What is the Relationship Between FRL and Reading and Math Proficiency
Proficiency_poster.RmdIn Iowa, Math & Reading proficiency is determined from the Iowa Statewide Assessment of Student Progress (ISASP). These tests show whether a student is "Not Yet Proficient", "Proficient", or "Advanced" for their grade level.
A student's eligibility for free or reduced lunch at school is primarily based on household income, making it an appropriate estimate for socioeconomic status.
Findings
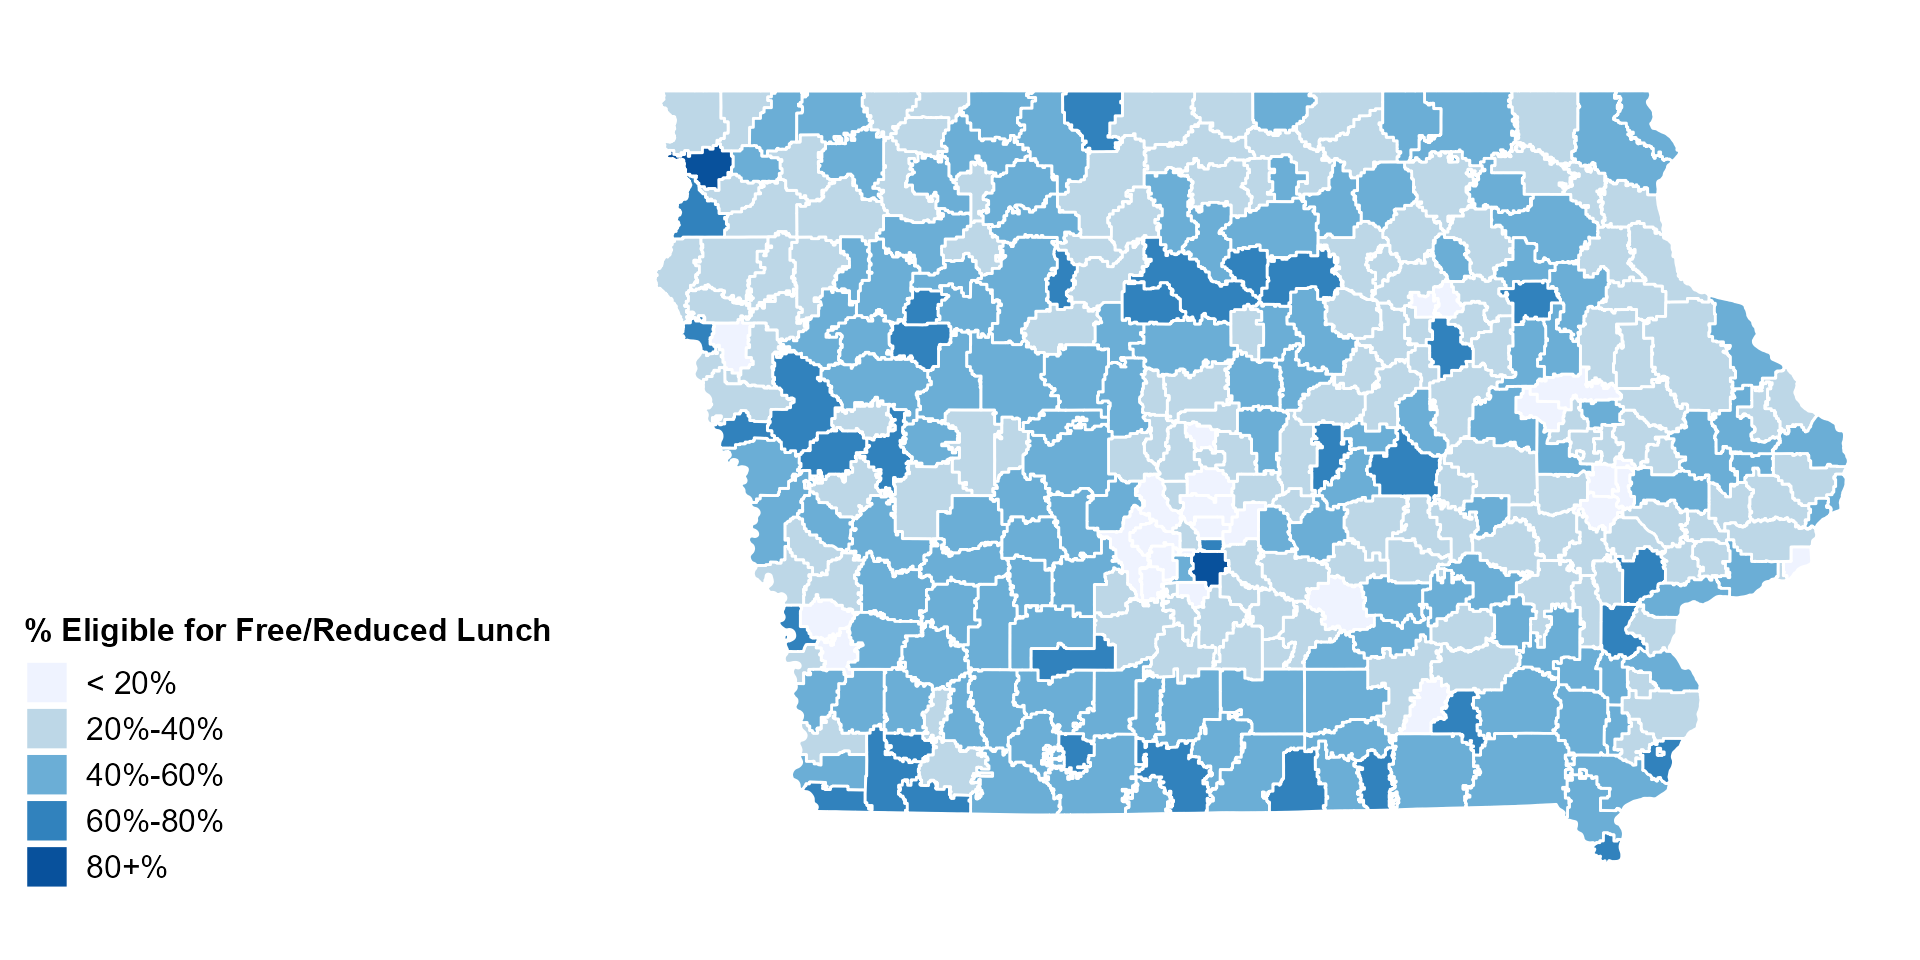
In 2018-2019, urban school districts with a city population of over 25,000 had the highest proportion of students eligible for free or reduced lunch.
There is a strong negative correlation (-0.689 and 0.678) between reading & math proficiency and free/reduced lunch eligibility for school districts in Iowa in 2018-2019 for all grade levels.
Regardless of school districts being urban or rural, there is a moderate-strong negative correlation between reading & math proficiency and free/reduced lunch eligibility in Iowa.
We found a moderate-strong correlation between proportion of students eligible for free/reduced lunch and proportion of minority students enrolled for school districts in Iowa during the 2020-2021 school year.
Data
Sources:
Proficiency Rate Data: https://educateiowa.gov/documents/proficiency-district/2021/05/2018-2019-isasp-proficiency-rates-district-and-grade
K-12 Eligible for Free or Reduced-Price Lunch by District: https://educateiowa.gov/document-type/district-frl
Urban/Rural Classification Data: 2019 Estimated City Population from the US Census Bureau Population Estimates Program
Loading, joining, and cleaning data
##----load-in-packages------------------------------------------------------------------
library(tidycensus)
#> Warning: package 'tidycensus' was built under R version 4.0.5
library(tidyverse)
#> Warning: package 'tidyverse' was built under R version 4.0.3
#> Warning: package 'ggplot2' was built under R version 4.0.5
#> Warning: package 'tibble' was built under R version 4.0.3
#> Warning: package 'tidyr' was built under R version 4.0.3
#> Warning: package 'readr' was built under R version 4.0.3
#> Warning: package 'purrr' was built under R version 4.0.3
#> Warning: package 'dplyr' was built under R version 4.0.3
library(tigris)
#> Warning: package 'tigris' was built under R version 4.0.5
library(mapview)
#> Warning: package 'mapview' was built under R version 4.0.5
library(leafsync)
#> Warning: package 'leafsync' was built under R version 4.0.5
library(leaflet)
#> Warning: package 'leaflet' was built under R version 4.0.5
library(plotly)
#> Warning: package 'plotly' was built under R version 4.0.4
library(stringr)
library(readxl)
#> Warning: package 'readxl' was built under R version 4.0.3
library(data.table)
#> Warning: package 'data.table' was built under R version 4.0.3
library(ggplot2)
library(janitor)
#> Warning: package 'janitor' was built under R version 4.0.5
library(dplyr)
library(ggthemes)
#> Warning: package 'ggthemes' was built under R version 4.0.5
library(colorspace)
#> Warning: package 'colorspace' was built under R version 4.0.3
library(xfun)
#> Warning: package 'xfun' was built under R version 4.0.5
options(scipen = 10000)
##----load-in-all-data------------------------------------------------------------------
reduced_r19 <- read_csv("../data_clean/Reading_Proficency_Benchmark_Data_2018-2019.csv")
#> Warning: Missing column names filled in: 'X1' [1]
reduced_m19 <- read_csv("../data_clean/Math_Proficency_Benchmark_Data_2018-2019.csv")
#> Warning: Missing column names filled in: 'X1' [1]
frl_19 <- read_excel("../data_clean/2018-2019 FRL Data.xlsx", skip = 6)
load("../data_clean/urban_classifications.Rda")
frl <- read_csv("../data_clean/dataClean_2020-21 Iowa Public School K-12 Students Eligible for Free or Reduced-Price Lunch by District.csv")
grad_intents <- read_csv("../data_clean/dataClean_IAGradIntentions1920.csv")
#> Warning: Missing column names filled in: 'X1' [1]
load("../data_clean/Free-Reduced-Lunch_IEP_data_2021.rda")
frl_iep_scatter_data <- read_csv("../data_clean/Free-Reduced-Lunch_IEP_scatterplot_data.csv")
load(file = "../data_clean/all_IEP_data.rda")
##----clean-IEP-column-names-------------------------------------------------------------
IEP_data <- all_data %>%
clean_names()
##---delete-X1-column--------------------------------------------------------------------
reduced_r19 <- reduced_r19[,2:38]
reduced_m19 <- reduced_m19[,2:38]
##----making-FRL-wide-format-------------------------------------------------------------
frl_wide <- spread(frl, Group, Value) %>%
clean_names()
class(frl_wide$district) = "numeric"
##----add-totals-rows-for-all-grade-levels-----------------------------------------------
totals_reading <- reduced_r19 %>%
mutate(total_tested = grade_3_total_tested + grade_4_total_tested + grade_5_total_tested +
grade_6_total_tested + grade_7_total_tested + grade_8_total_tested +
grade_10_total_tested + grade_11_total_tested,
total_proficient = grade_3_proficient + grade_4_proficient + grade_5_proficient +
grade_6_proficient + grade_7_proficient + grade_8_proficient +
grade_10_proficient + grade_11_proficient,
total_percent = (total_proficient/total_tested)*100)
totals_math <- reduced_m19 %>%
mutate(total_tested = grade_3_total_tested + grade_4_total_tested + grade_5_total_tested +
grade_6_total_tested + grade_7_total_tested + grade_8_total_tested +
grade_10_total_tested + grade_11_total_tested,
total_proficient = grade_3_proficient + grade_4_proficient + grade_5_proficient +
grade_6_proficient + grade_7_proficient + grade_8_proficient +
grade_10_proficient + grade_11_proficient,
total_percent = (total_proficient/total_tested)*100)
##----converting-district_number-to-numeric---------------------------------------------
class(totals_reading$district_number) = "numeric"
class(totals_math$district_number) = "numeric"
##----joining-rurality-data-to-totals-data-----------------------------------------------
reading_rurality <- left_join(totals_reading, filtered_rur, by = c("district_number" = "DE_DIST"))
math_rurality <- left_join(totals_math, filtered_rur, by = c("district_number" = "DE_DIST"))
frl_rurality <- left_join(frl_wide, filtered_rur, by = c("district" = "DE_DIST"))
##----change-Urban/Rural-classification-to-population-interval---------------------------
reading_rurality <- reading_rurality %>%
mutate(category = ifelse(reading_rurality$classification == "Rural", "Under 500",
ifelse(reading_rurality$classification == "Rural Plus", "500 - 2,499",
ifelse(reading_rurality$classification == "Urban Cluster", "2,500 - 9,999",
ifelse(reading_rurality$classification == "Micropolitan", "10,000 - 24,999", "Over 25,000")))))
math_rurality <- math_rurality %>%
mutate(category = ifelse(math_rurality$classification == "Rural", "Under 500",
ifelse(math_rurality$classification == "Rural Plus", "500 - 2,499",
ifelse(math_rurality$classification == "Urban Cluster", "2,500 - 9,999",
ifelse(math_rurality$classification == "Micropolitan", "10,000 - 24,999", "Over 25,000")))))
frl_rurality <- frl_rurality %>%
mutate(category = ifelse(frl_rurality$classification == "Rural", "Under 500",
ifelse(frl_rurality$classification == "Rural Plus", "500 - 2,499",
ifelse(frl_rurality$classification == "Urban Cluster", "2,500 - 9,999",
ifelse(frl_rurality$classification == "Micropolitan", "10,000 - 24,999", "Over 25,000")))))
##----cleaning-up-columns-for-FRL-data----------------------------------------------------
clean_frl <- frl_19 %>%
clean_names() %>%
select(1:9) %>%
filter(district_name != "STATEWIDE TOTALS")
names(clean_frl)[1] <- "county"
names(clean_frl)[3] <- "district_number"
names(clean_frl)[9] <- "pct_eligible"
##----select-only-important-columns-from-benchmark-and-frl-data----------------------------
selected_FRL <- clean_frl %>%
select(district_number, district_name, pct_eligible)
selected_reading <- totals_reading %>%
head(-2) %>%
select(district_number, total_percent)
selected_math <- totals_math %>%
head(-2) %>%
select(district_number, total_percent)
##----join-FRL-and-benchmark-data----------------------------------------------------------
class(selected_reading$district_number) = "numeric"
class(selected_math$district_number) = "numeric"
FRL_and_reading <- inner_join(selected_FRL, selected_reading, by = 'district_number')
FRL_and_math <- inner_join(selected_FRL, selected_math, by = 'district_number')
##----change-Urban/Rural-classification-to-population-intervals--------------------------
filtered_rur <- filtered_rur %>%
mutate(category = ifelse(filtered_rur$classification == "Rural", "Under 500",
ifelse(filtered_rur$classification == "Rural Plus", "500 - 2,499",
ifelse(filtered_rur$classification == "Urban Cluster", "2,500 - 9,999",
ifelse(filtered_rur$classification == "Micropolitan", "10,000 - 24,999", "Over 25,000")))))
##----join-rurality-data-with-reading-and-math-frl-data-----------------------------------
reading_frl_rur <- left_join(FRL_and_reading, filtered_rur, by = c("district_number" = "DE_DIST"))
math_frl_rur <- left_join(FRL_and_math, filtered_rur, by = c("district_number" = "DE_DIST"))
##---list-out-districts-without-rurality---------------------------------------------------
no_match_rurality <- reading_frl_rur %>%
filter(is.na(category))
##----get-rid-of-NA-values------------------------------------------------------------------
reading_no_NAs <- na.omit(reading_frl_rur)
math_no_NAs <- na.omit(math_frl_rur)
##----subset-and-arrange-data-for-bar-graphs----------------------------------------------
summed_rur_data <- frl_rurality %>%
group_by(category) %>%
summarize(proportion = (sum(number_eligible_free_reduced_price_lunch)/sum(k_12_enrollment))*100)
##----filter-for-military-intentions------------------------------------------------------
military_data <- grad_intents %>%
filter(Group == "Overall" & (Intention == "Military" | Intention == "Diploma Count"))
military_data <- military_data[,2:8]
military_wide <- spread(military_data, Intention, Count) %>%
clean_names()
class(military_wide$district) = "numeric"
##----joining-military-and-FRL-data------------------------------------------------------
military_frl <- inner_join(frl_wide, military_wide, by = "district")
mil_frl_props <- military_frl %>%
mutate(military_prop = military/diploma_count) %>%
select(c(5,12,19))
##----add-rurality-status-to-military/FRL-data-------------------------------------------
rur_mil_frl <- inner_join(mil_frl_props, filtered_rur, by = c("district" = "DE_DIST"))
##----get-non-white-enrollment-to compare with military-----------------------------------
minority_prop <- grad_intents %>%
filter(Intention == "Diploma Count" & (Group == "Overall" | Group == "White"))
minority_prop <- minority_prop[,2:8]
minority_wide <- spread(minority_prop, Group, Count) %>%
clean_names()
minority <- minority_wide %>%
mutate(non_white_prop = (overall-white)/overall) %>%
select(district, non_white_prop)
class(minority$district) = "numeric"
##----combine-with-military-props---------------------------------------------------------
minority_military <- inner_join(mil_frl_props, minority, by = "district")
##----grabbing-tigris-shape-data-for-race-graphs------------------------------------------------
ia_schools <- school_districts("Iowa", year = 2020)
##----extract-iep-data-for-year-2021---------------------------------------------------------
iep_data_2021 <- IEP_data %>%
select(county, district_number, district_name, year, all_students, all_iep_students) %>%
filter(year == 2021)
##----creating-props-for-iep-graph--------------------------------------------------------------
iep_2021_props <- iep_data_2021 %>%
mutate(proportion = (all_iep_students/all_students)*100)
##----sorting-school-districts-alphabetically---------------------------------------------------
sorted_ieps <- iep_2021_props %>%
arrange(district_name)
sorted_ia_schools <- ia_schools %>%
arrange(NAME)
##----adding-ids-to-sorted-data-sets------------------------------------------------------------
ieps_with_ids <- sorted_ieps %>%
mutate(id = 1:327)
ia_schools_with_ids <- sorted_ia_schools %>%
mutate(id = 1:327)
##----join-race-data-with-school-district-geometry----------------------------------------------
map_iep_data <- inner_join(ia_schools_with_ids, ieps_with_ids, by = 'id')
##----joining-geometry-data-to-FRL-props--------------------------------------------------------
class(map_iep_data$district_number) = "numeric"
class(frl_iep_scatter_data$district_number) = "numeric"
joined_frl <- left_join(map_iep_data, frl_iep_scatter_data, by = "district_number")
joined_frl$frl_proportion <- replace_na(joined_frl$frl_proportion, 38.07) #found this proportion manually
##----creating-FRL-iowa-SD-map-bins-------------------------------------------------------------
frl_map2 <- joined_frl %>%
mutate(prop_bins2 = ifelse(joined_frl$frl_proportion < 20, "< 20%",
ifelse(joined_frl$frl_proportion < 40, "20%-40%",
ifelse(joined_frl$frl_proportion < 60, "40%-60%",
ifelse(joined_frl$frl_proportion < 80, "60%-80%","80+%")))))Methodology
Reading & Math Proficiency and Free/Reduced Lunch Scatter Plots
reading_FRL_scatter <- FRL_and_reading %>%
ggplot(aes(y = total_percent, x = pct_eligible)) +
geom_point(color = "#D81E3F") +
labs(title = "Iowa School Districts by Free/Reduced Lunch Eligibility and Reading Proficiency",
subtitle = "Source: Department of Education Data 2018-2019",
y = "Proportion Proficient in Reading",
x = "Proportion Eligible for Free/Reduced Lunch") +
geom_smooth(method = "lm", se = FALSE, color = "black") +
theme_minimal()
reading_FRL_scatter
#> Warning: Removed 20 rows containing non-finite values (stat_smooth).
#> Warning: Removed 20 rows containing missing values (geom_point).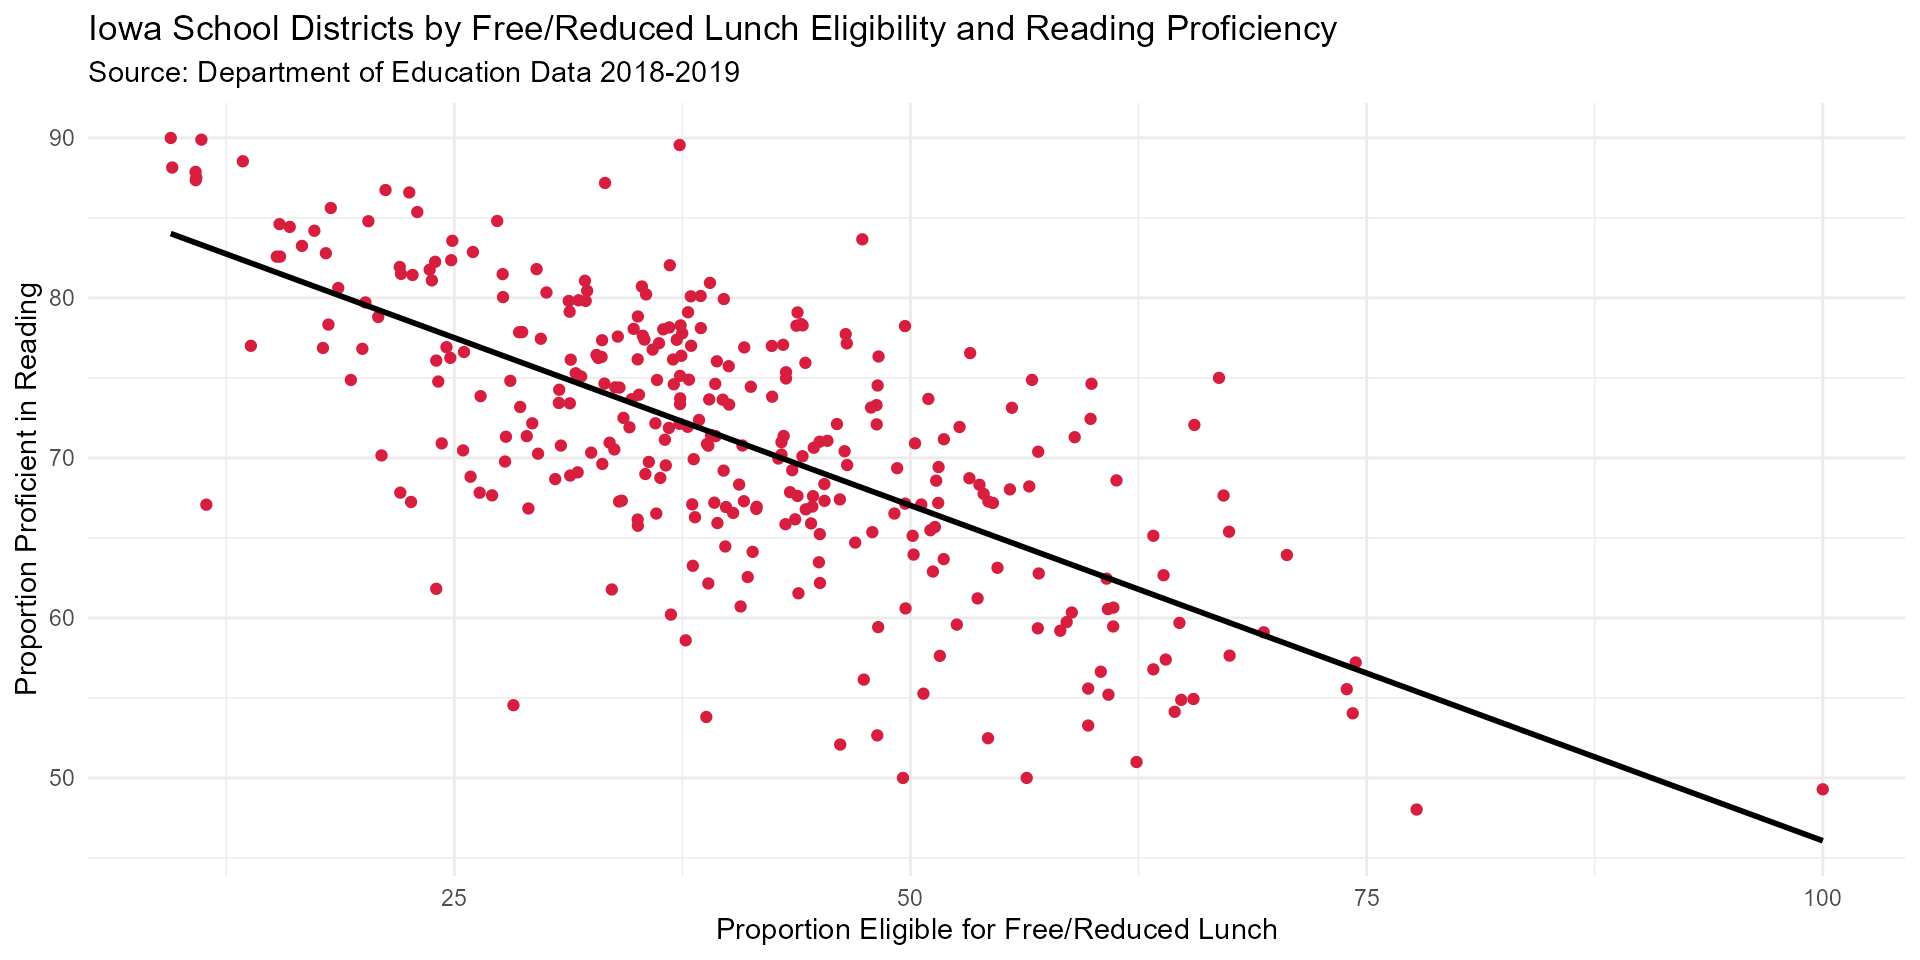
math_FRL_scatter <- FRL_and_math %>%
ggplot(aes(y = total_percent, x = pct_eligible)) +
geom_point(color = "#2A6EBB") +
labs(title = "Iowa School Districts by Free/Reduced Lunch Eligibility and Math Proficiency",
subtitle = "Source: Department of Education Data 2018-2019",
y = "Proportion Proficient in Math",
x = "Proportion Eligible for Free/Reduced Lunch") +
geom_smooth(method = "lm", se = FALSE, color = "black") +
theme_minimal()
math_FRL_scatter
#> Warning: Removed 18 rows containing non-finite values (stat_smooth).
#> Warning: Removed 18 rows containing missing values (geom_point).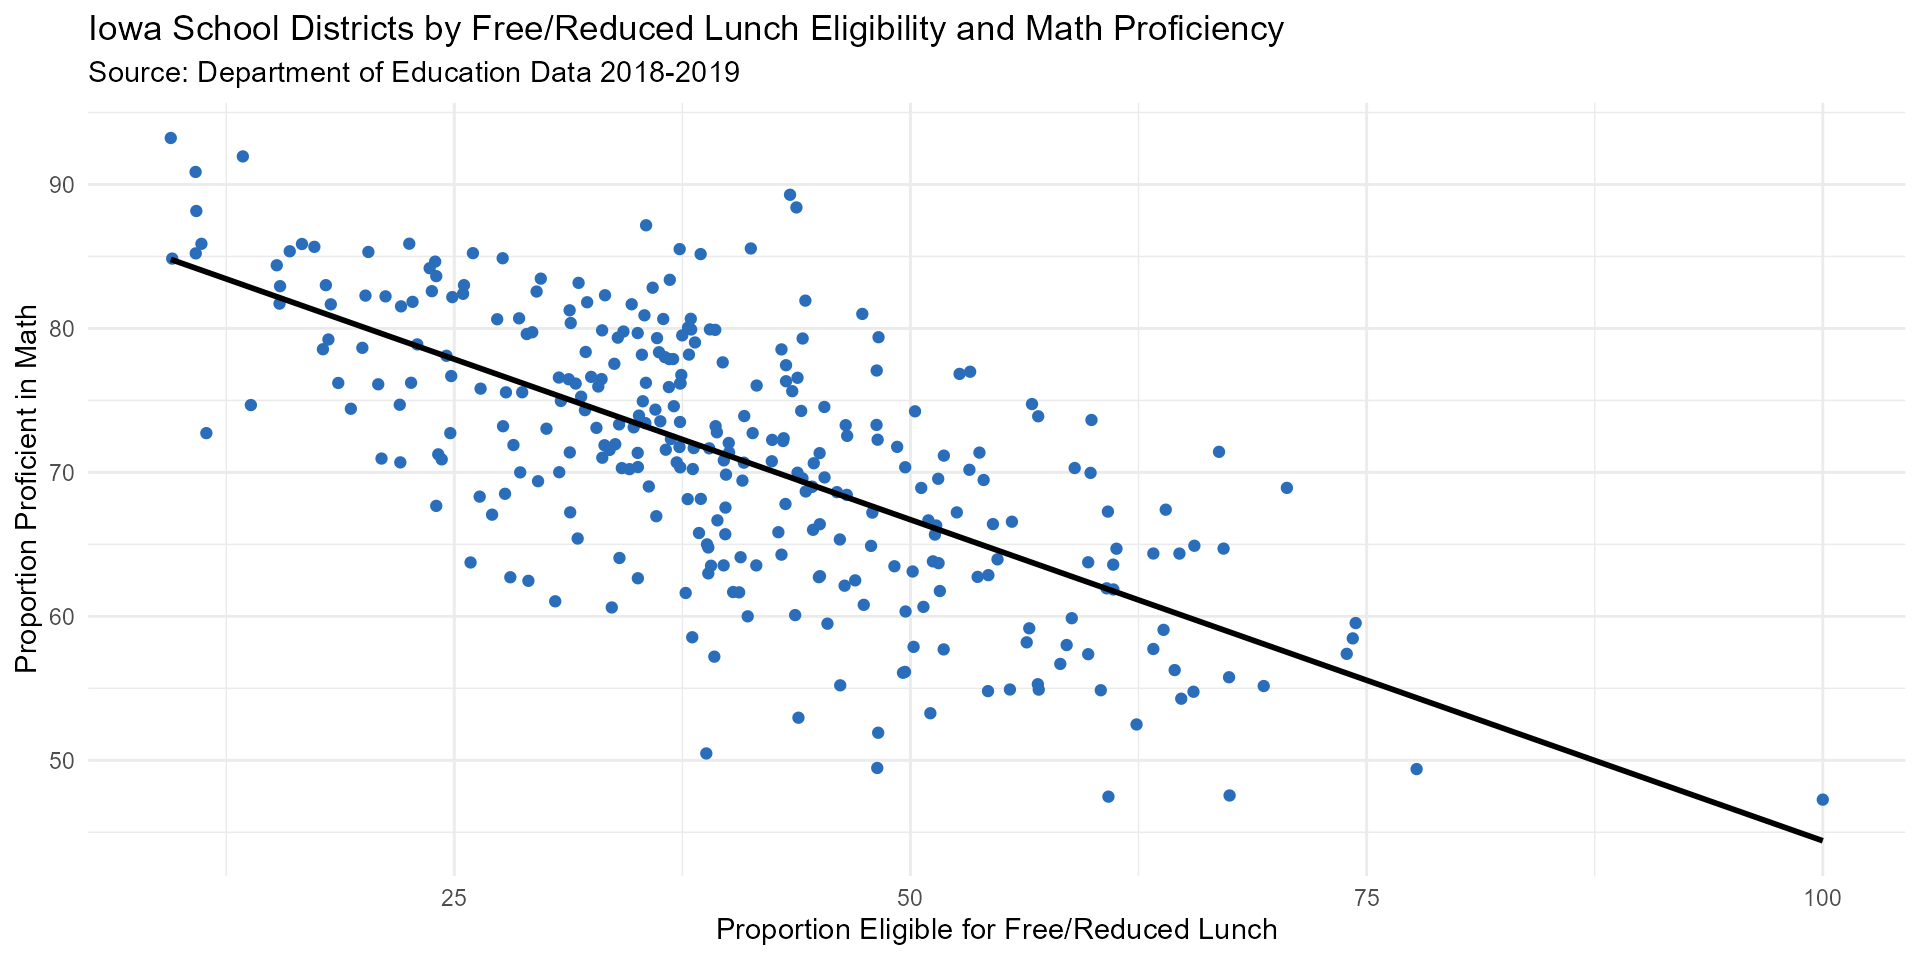
Download Graph: Reading (SVG) Reading (PNG)
Proficiency and Free/Reduced Lunch by Urban/Rural Classification Faceted Scatter Plots
reading_FRL_scatter3 <- reading_no_NAs %>%mutate(category = fct_relevel(category,
"Over 25,000", "10,000 - 24,999", "2,500 - 9,999",
"500 - 2,499", "Under 500")) %>%
ggplot(aes(y = total_percent, x = pct_eligible, color = category)) +
geom_point() +
labs(title = "Iowa School Districts by Free/Reduced Lunch Eligibility and Reading Proficiency",
subtitle = "Source: Department of Education Data 2018-2019",
y = "Proportion Proficient in Reading",
x = "Proportion Eligible for Free/Reduced Lunch",
color = "Population") +
theme_minimal() +
facet_wrap(vars(category)) +
scale_colour_manual(values = c("#2a6ebb","#8cb1da","#c9c9c9","#e35c74", "#d81e3f"))
reading_FRL_scatter3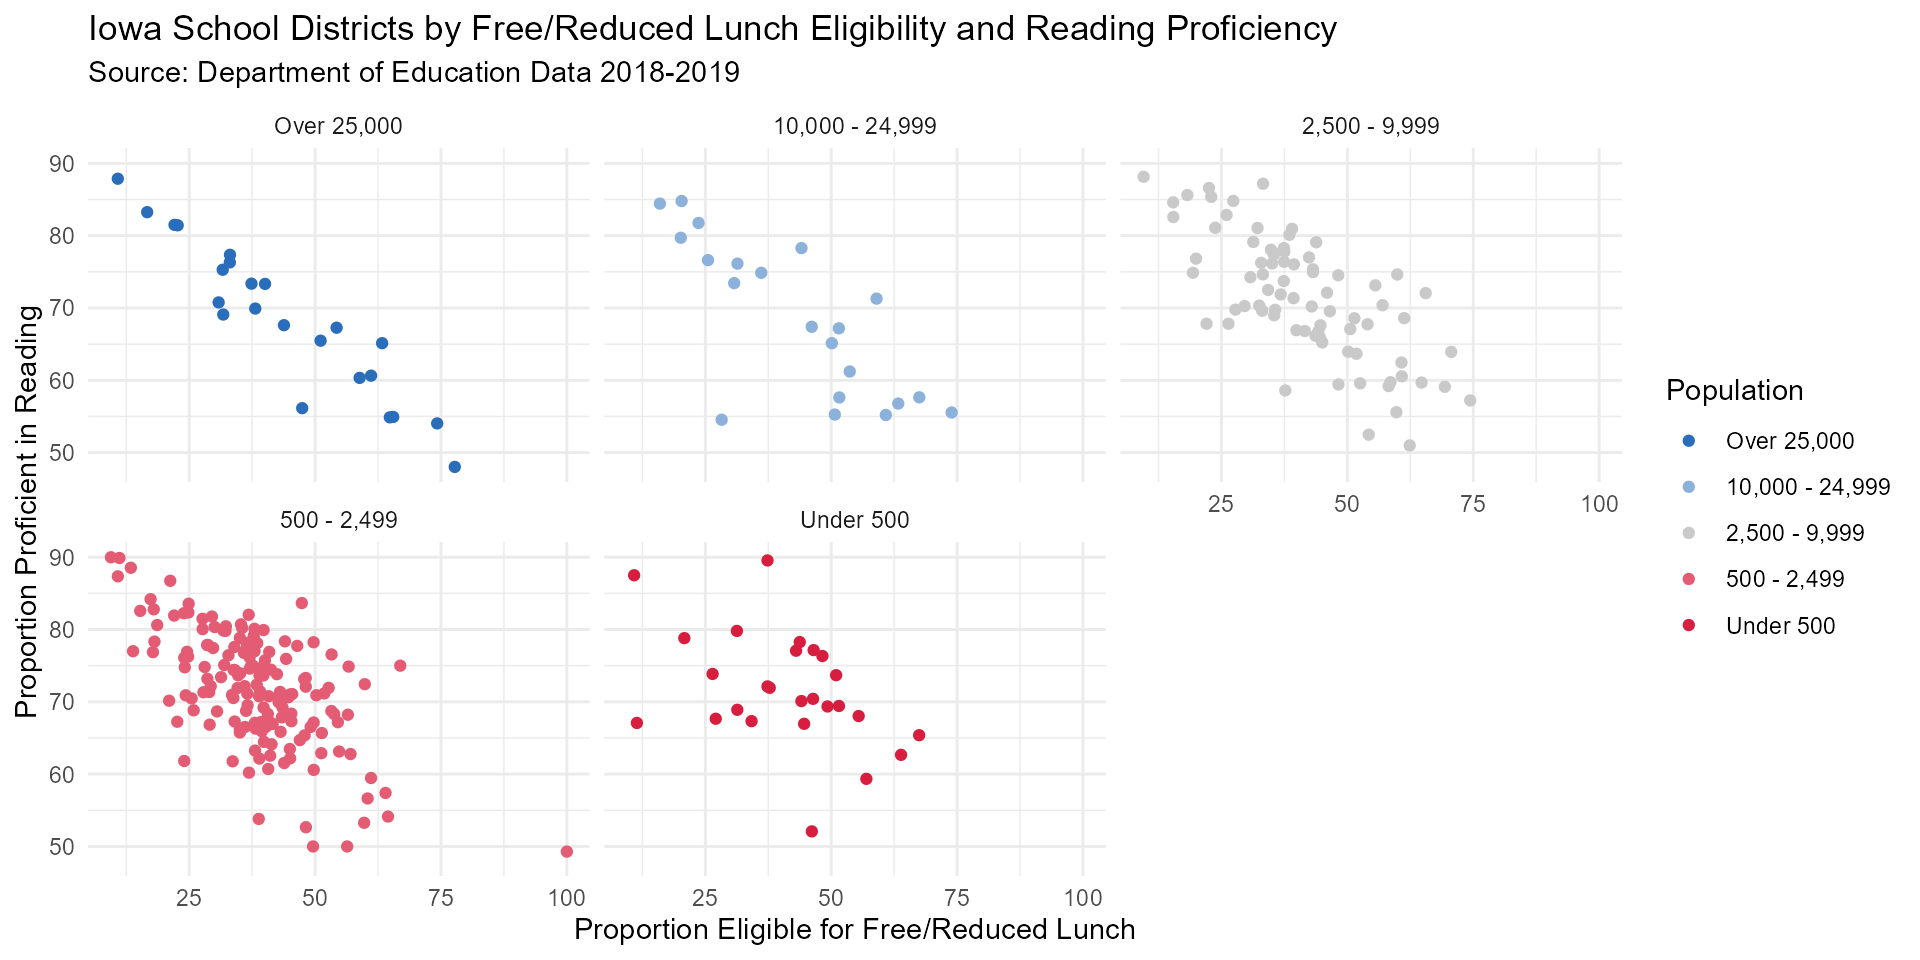
math_FRL_scatter3 <- math_no_NAs %>%mutate(category = fct_relevel(category,
"Over 25,000", "10,000 - 24,999", "2,500 - 9,999",
"500 - 2,499", "Under 500")) %>%
ggplot(aes(y = total_percent, x = pct_eligible, color = category)) +
geom_point() +
labs(title = "Iowa School Districts by Free/Reduced Lunch Eligibility and Math Proficiency",
subtitle = "Source: Department of Education Data 2018-2019",
y = "Proportion Proficient in Math",
x = "Proportion Eligible for Free/Reduced Lunch",
color = "Population") +
theme_minimal() +
facet_wrap(vars(category)) +
scale_colour_manual(values = c("#2a6ebb","#8cb1da","#c9c9c9","#e35c74", "#d81e3f"))
math_FRL_scatter3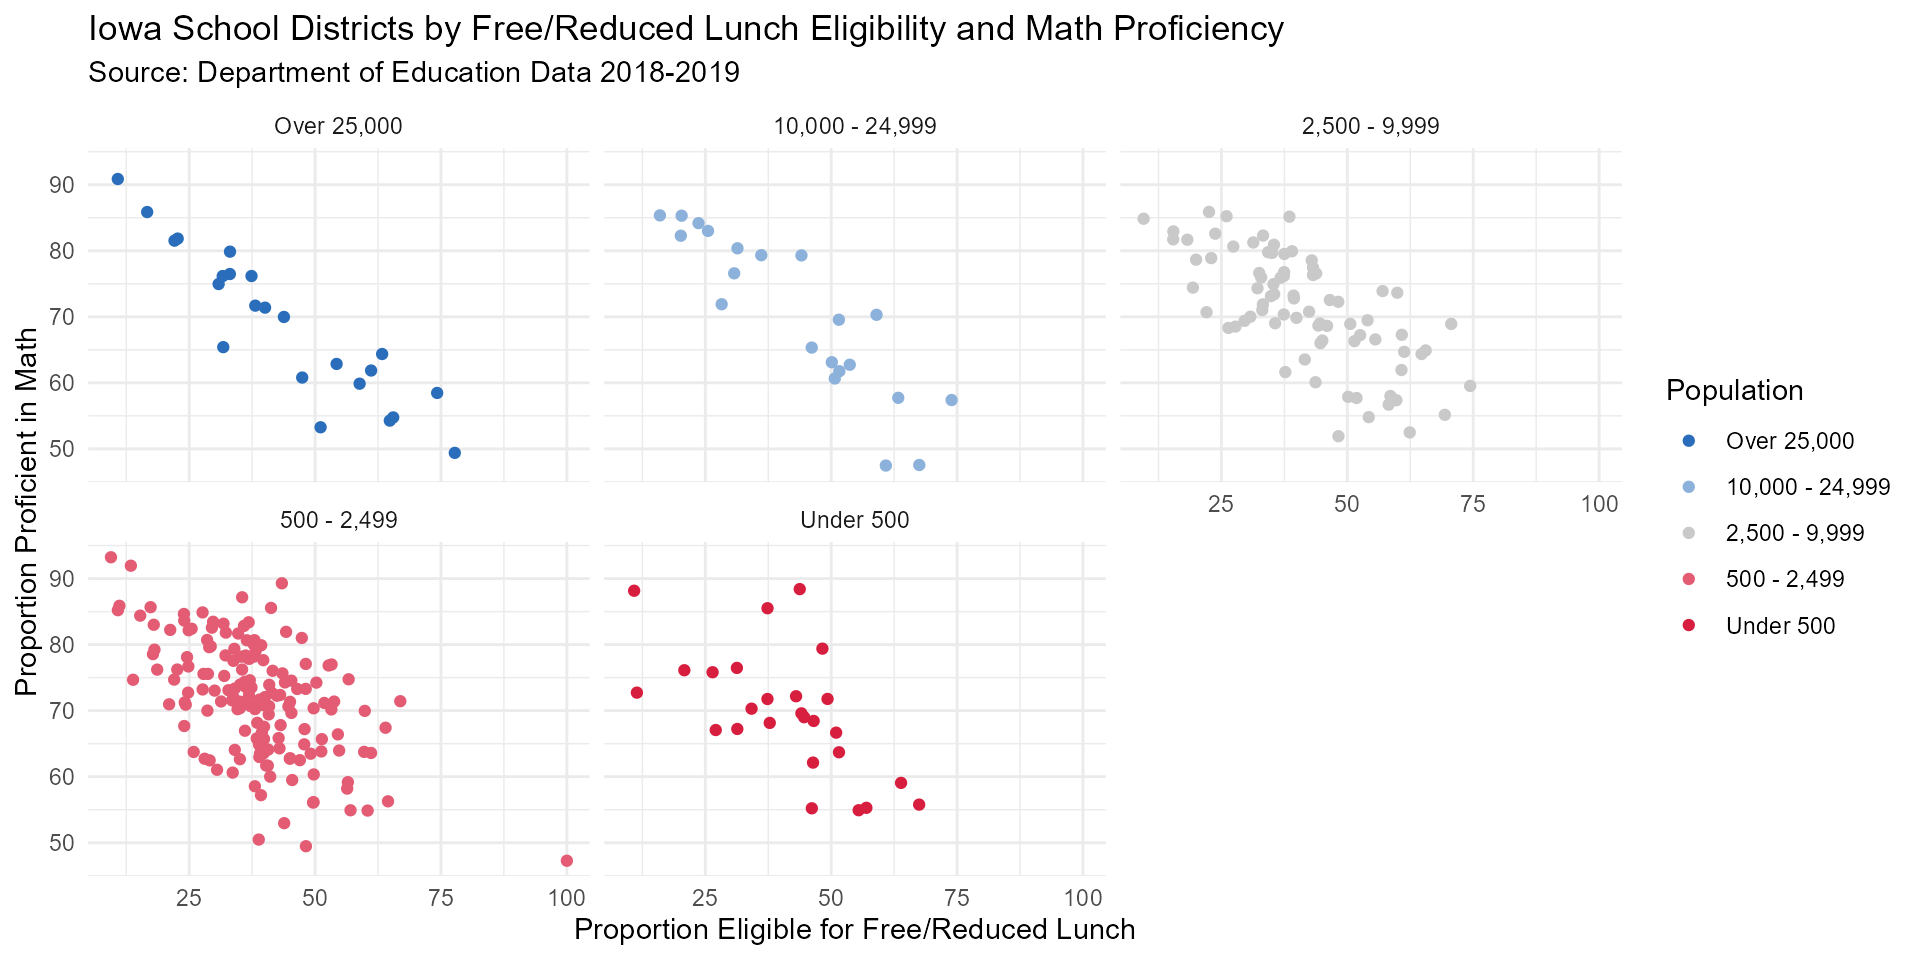
Download Graph: Reading (SVG) Reading (PNG)
Rural/Urban Population Bar Graph
##----make-bar-graph-for-FRL/Rural--------------------------------------------------------
rural_frl_bar <- summed_rur_data %>% mutate(category = fct_relevel(category,
"Over 25,000", "10,000 - 24,999", "2,500 - 9,999",
"500 - 2,499", "Under 500")) %>%
ggplot(aes(x = category, y = proportion, fill = category)) +
geom_bar(stat = "identity", color = "black") +
labs(title = "Proportion of Student Eligible for Free/Reduced Lunch in Iowa",
subtitle = "Source: Department of Education Data 2018-2019",
x = "",
y = "Propotion",
fill = "Population") +
scale_fill_manual(values = c("#2a6ebb","#8cb1da","#c9c9c9","#e35c74", "#d81e3f")) +
theme_minimal()
rural_frl_bar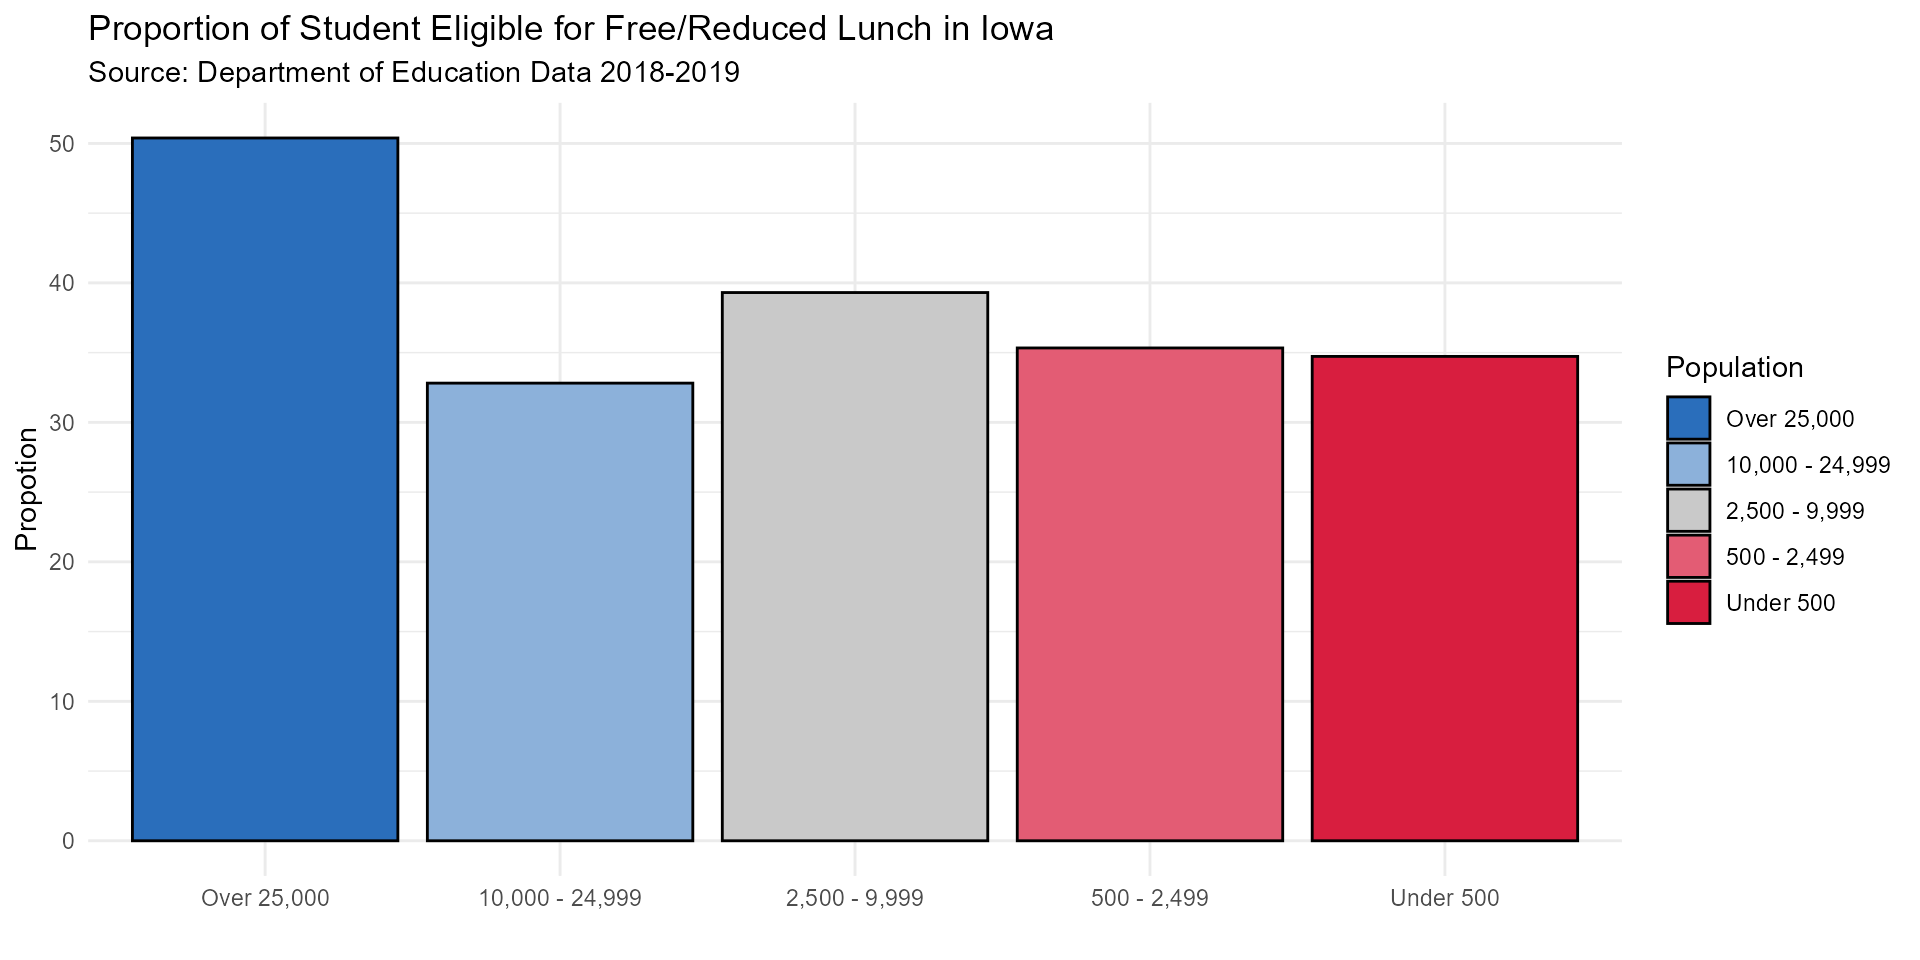
Minority & Free/Reduced Lunch Scatter Plot
minority_FRL_scatter <- minority_military %>%
ggplot(aes(y = percent_free_reduced_price_lunch, x = non_white_prop)) +
geom_point(color = "#D81E3F") +
labs(title = "Iowa School Districts by Free/Reduced Lunch Eligibility and Minority Population",
subtitle = "Source: Department of Education Data 2020-2021",
y = "Eligible for Free/Reduced Lunch (Proportion)",
x = "Minority Population (Proportion)") +
theme_minimal()
minority_FRL_scatter
#> Warning: Removed 25 rows containing missing values (geom_point).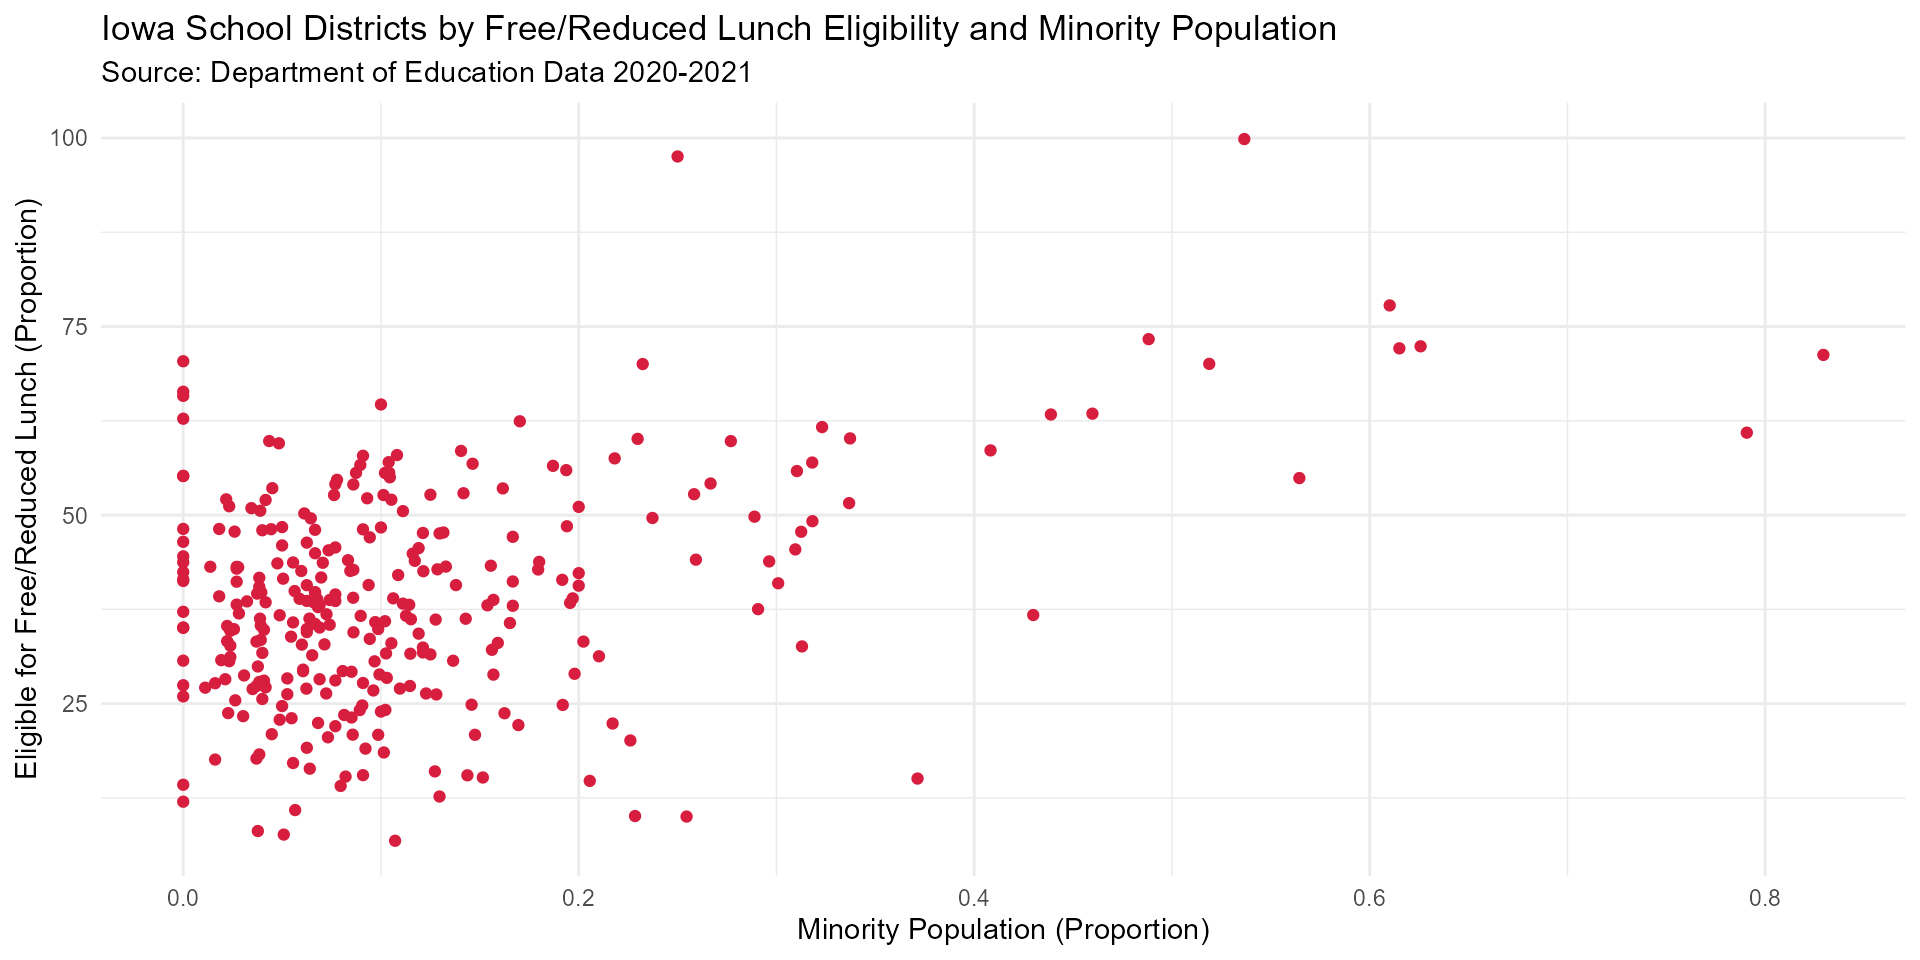
School Districts by Free/Reduced Lunch Iowa Map
ggplot(frl_map2, aes(fill = prop_bins2)) +
geom_sf(color = "white", aes(geometry = geometry)) +
theme_map() +
scale_fill_brewer(palette = "Blues",
name = "% Eligible for Free/Reduced Lunch",
na.value = "#B3B3B3") +
theme(legend.title = element_text(size = 12, face = "bold"),
legend.text = element_text(size = 12),
legend.position = "left")