Which Students are English Learners?
EL_poster.RmdFindings
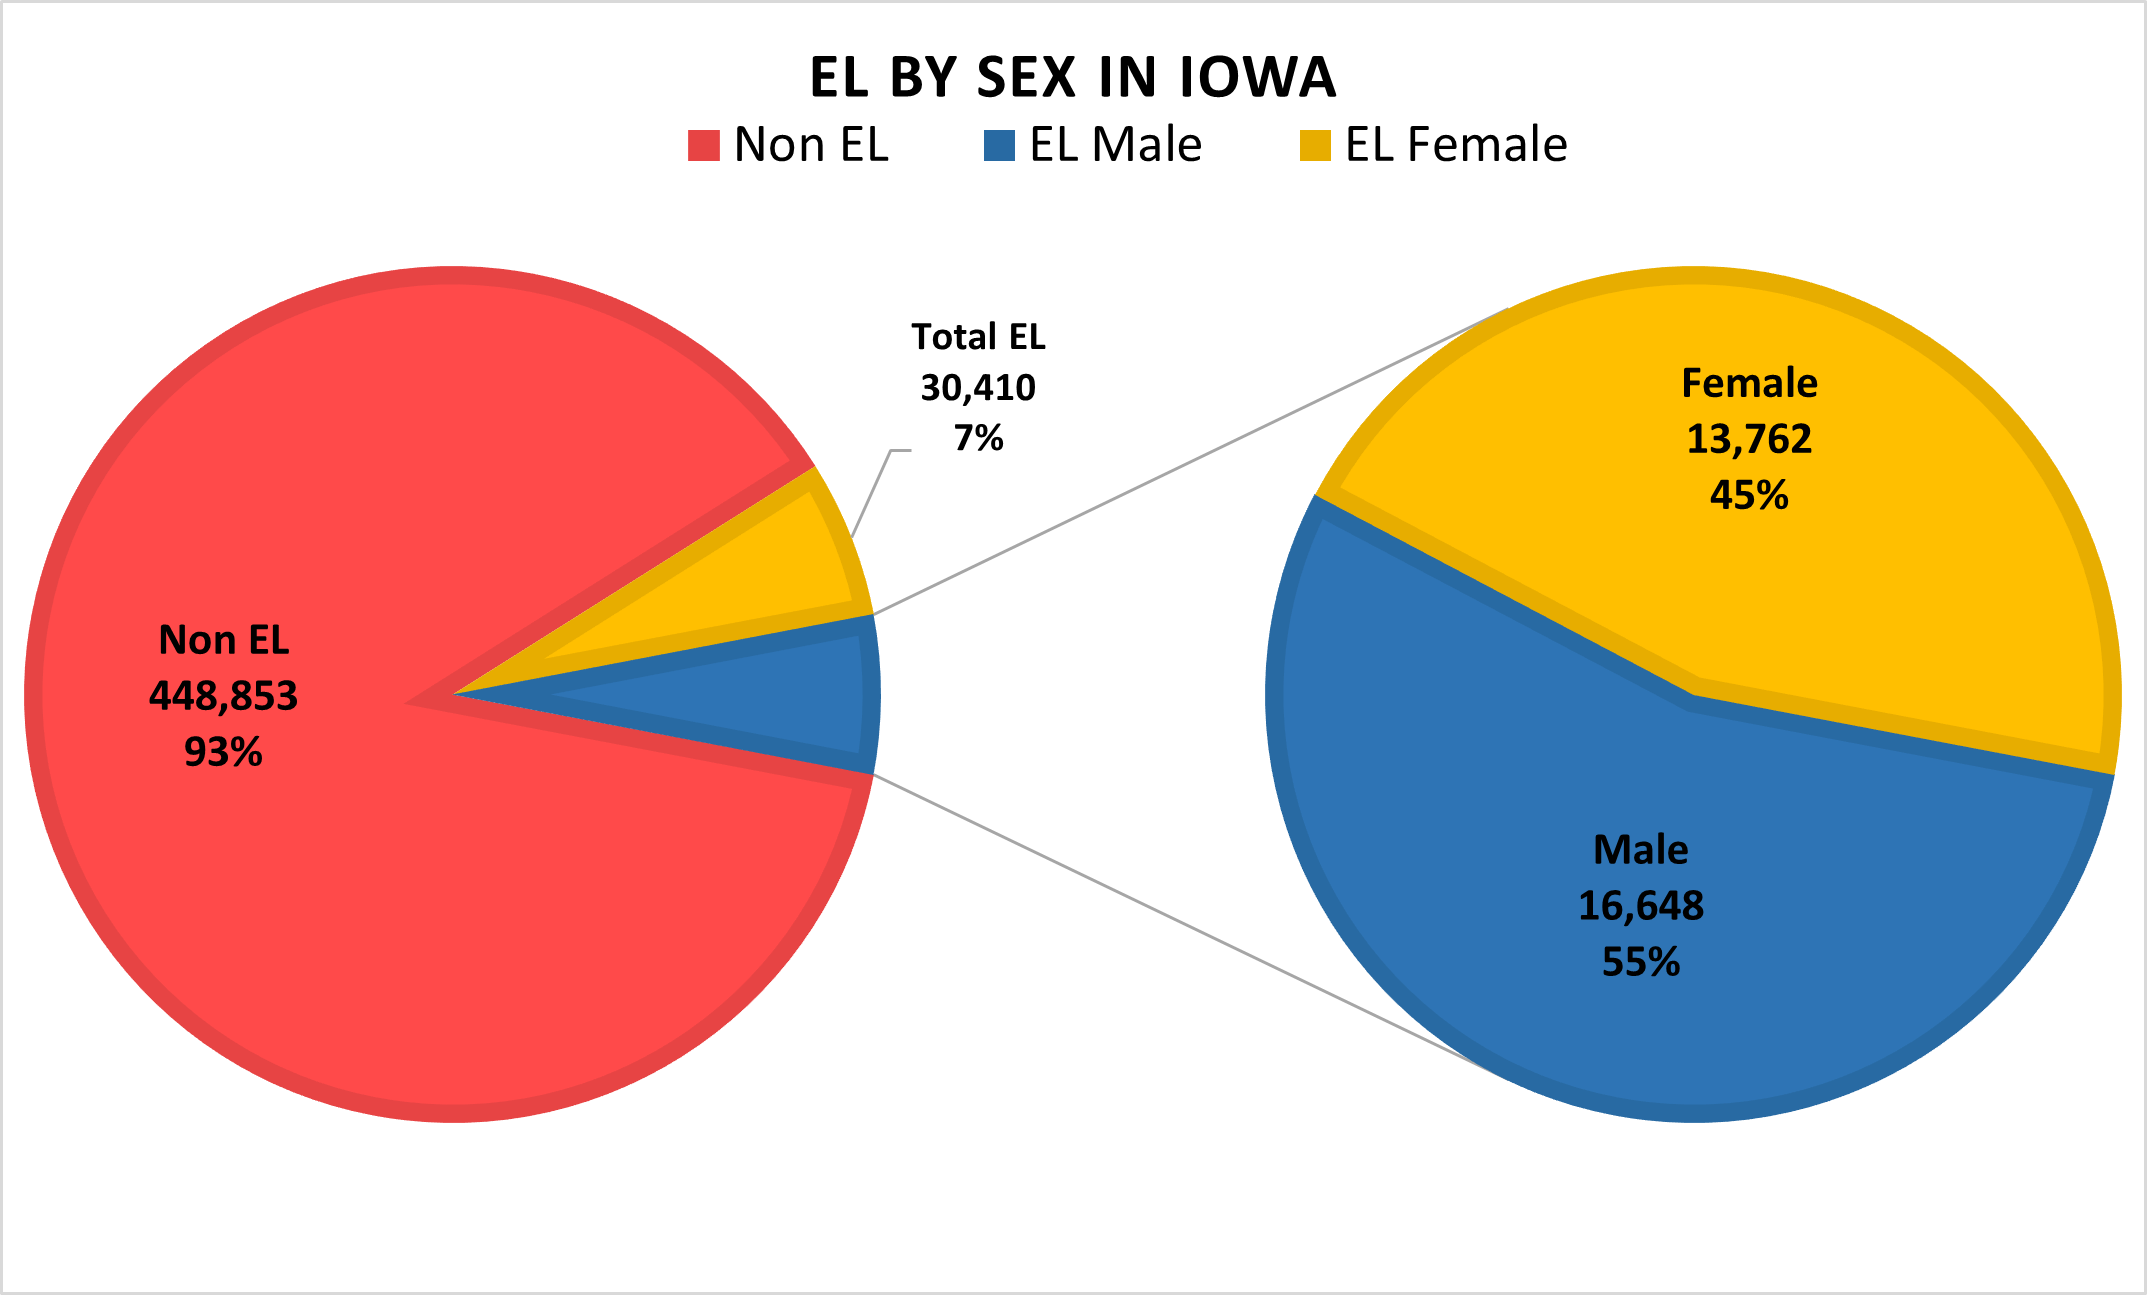
In 2020-2021, 7 percent of students enrolled in K-12 are English Learners in Iowa. Of these EL students, there are 5 percent more males than females.
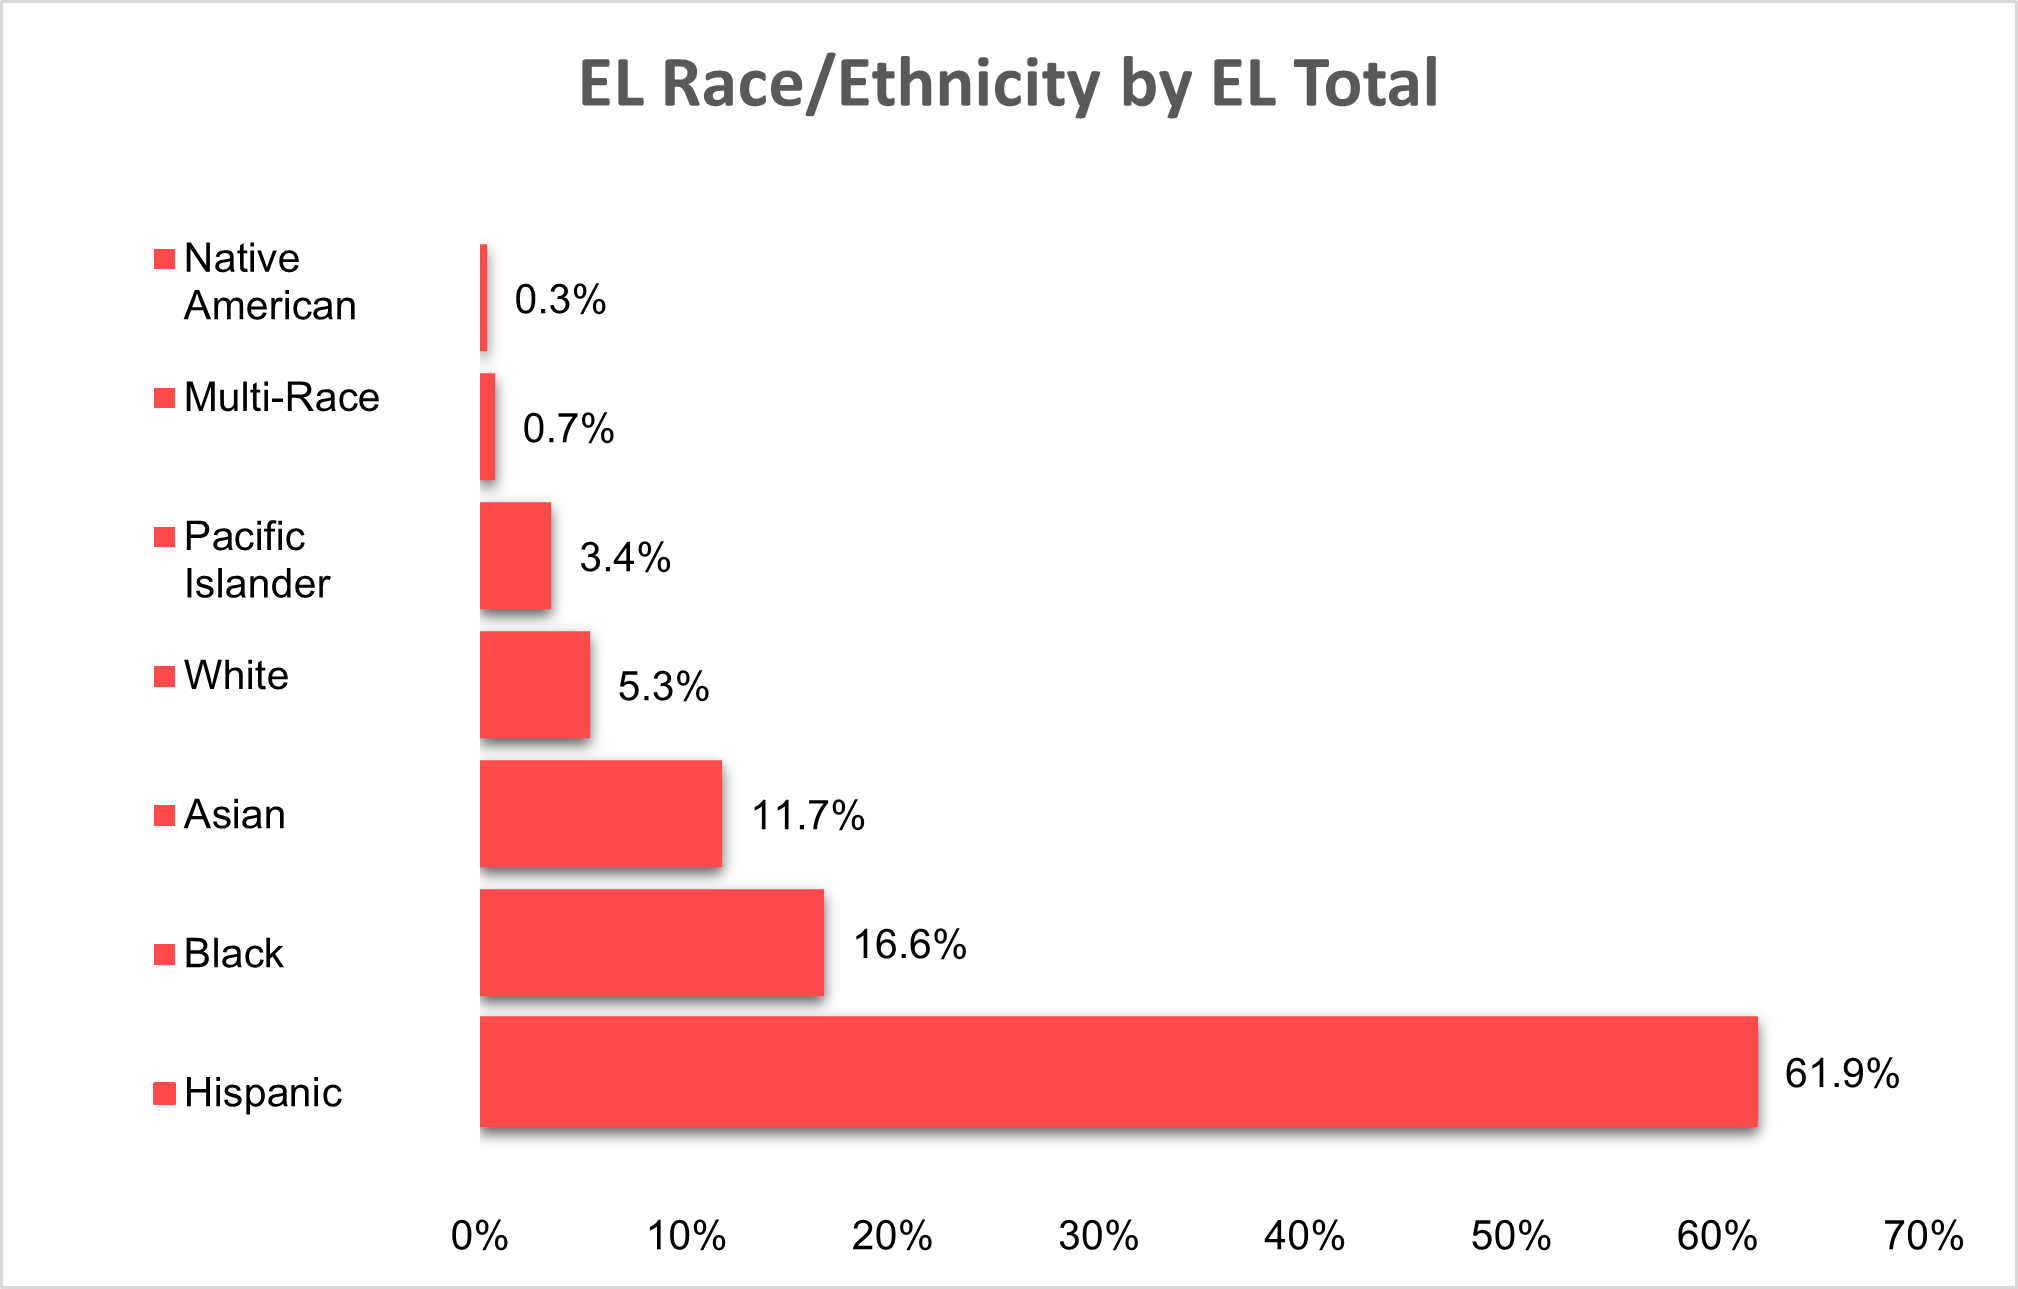
The majority of English Learners in Iowa enrolled in K-12 identify as Hispanic.
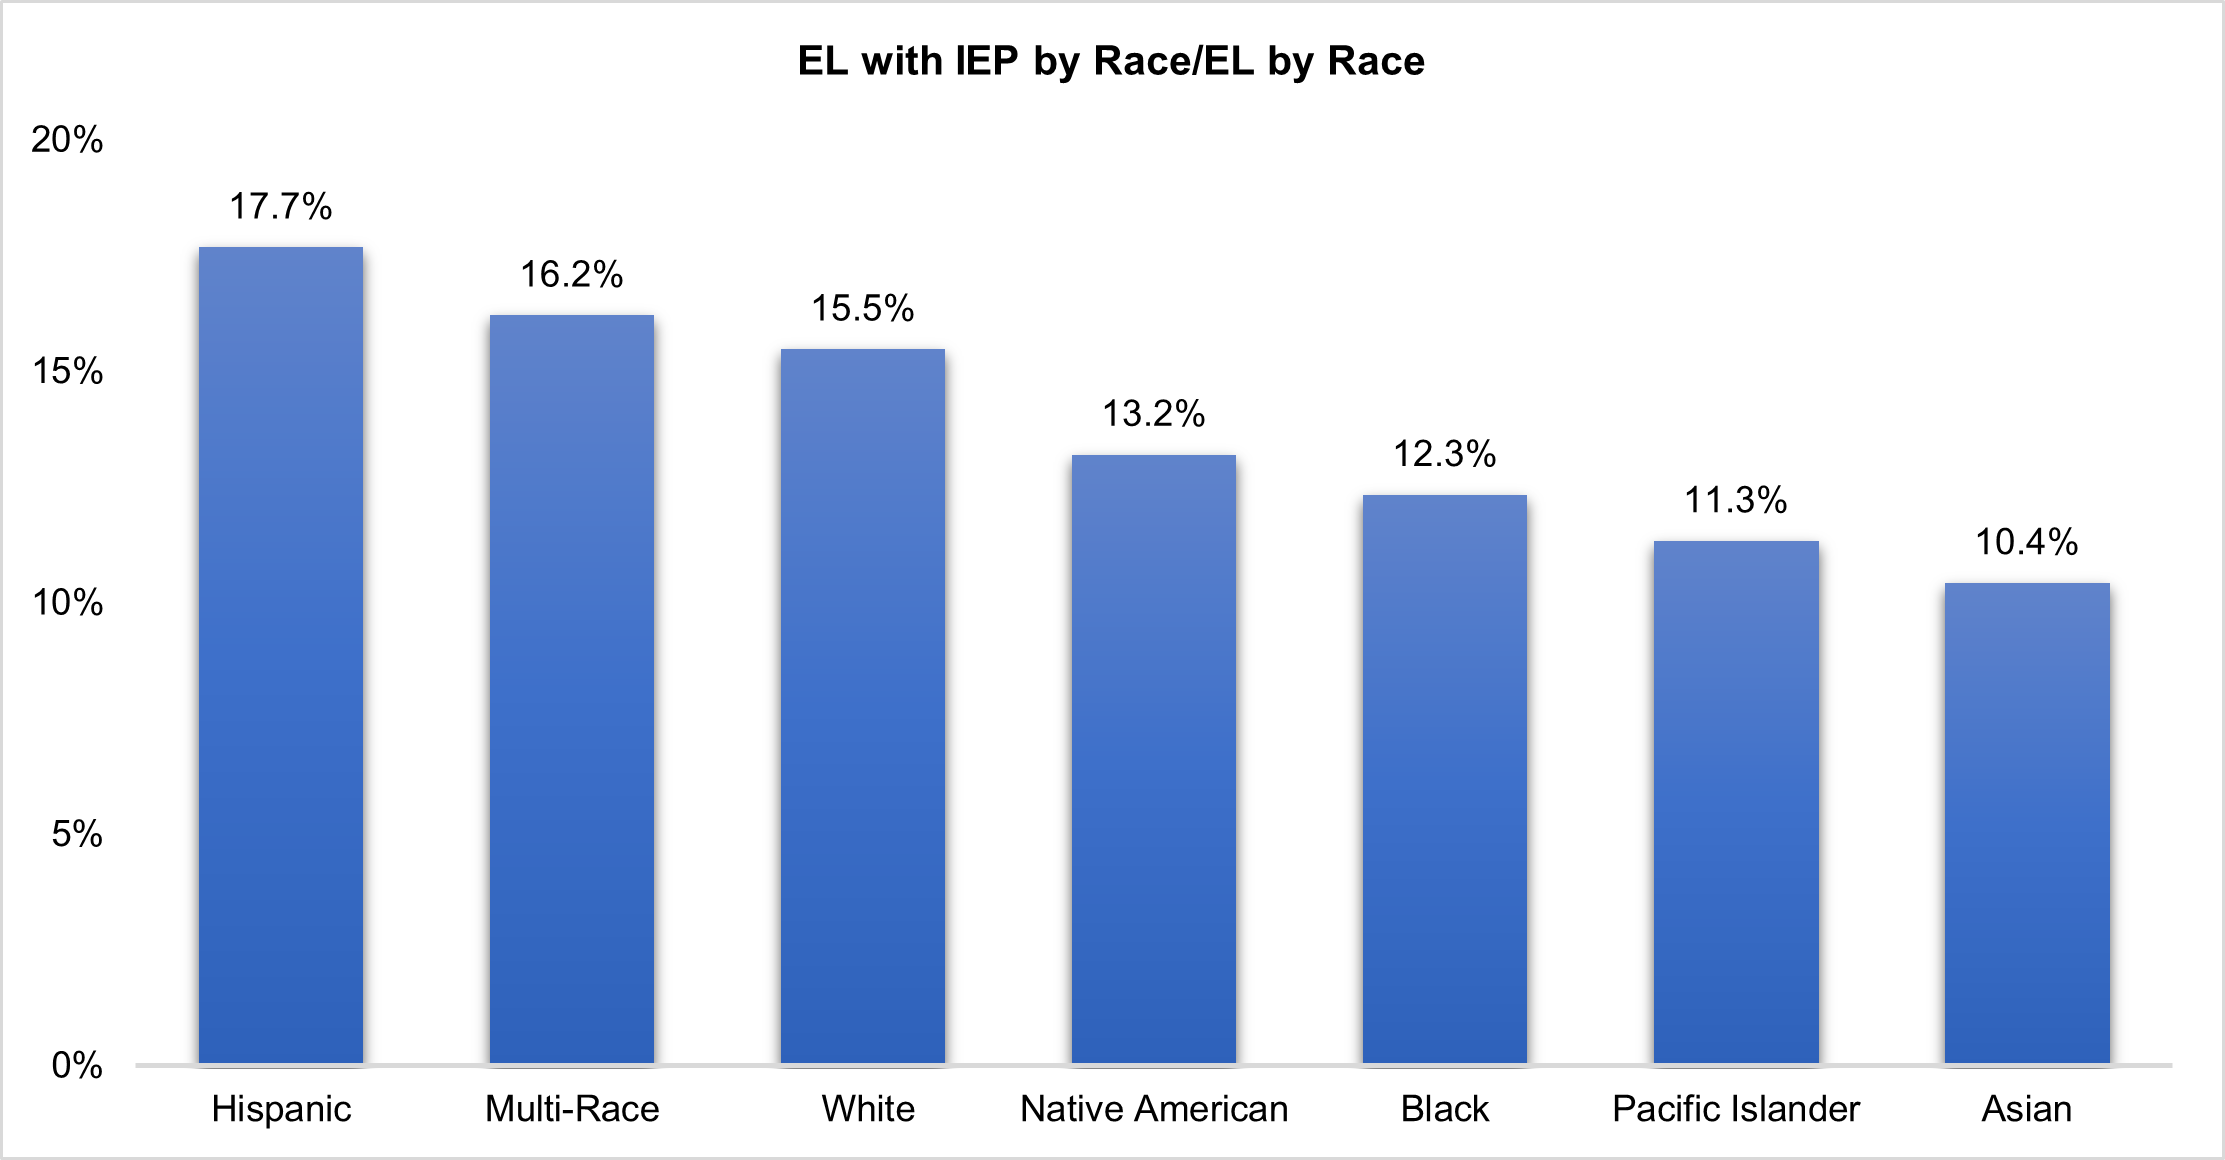
The proportion of EL students with an IEP is around 17.7 percent with Hispanic being the largest group and Asian being the smallest group at around 10.4 percent.
Data
Sources:
EL by IEP looking at gender, race, and dropout rates 19-20: Data Request
EL by Race and Gender: Data Request
EL by District and Grade: https://educateiowa.gov/document-type/district-el
Methodology
Loading in dataset and formatting
el <- na.omit(read_excel("../data_raw/2019-2020 Iowa Public School K-12 English Learners (EL) by District and Grade_0.xlsx",
skip = 5))
el[c(1, 3, 4)] <- sapply(el[c(1, 3, 4)], as.numeric)
## load in county data
schools <- school_districts("Iowa", year = 2020, progress_bar = F)
## standarzing district names in schools
schools$NAME <- toupper(schools$NAME)
schools$NAME <- gsub("COMMUNITY SCHOOL DISTRICT", "", schools$NAME)
schools$NAME <- gsub("INDEPENDENT SCHOOL DISTRICT", "IND", schools$NAME)
schools$NAME <- gsub("SCHOOL DISTRICT", "", schools$NAME)
schools$NAME <- gsub("-", "", schools$NAME)
schools$NAME <- gsub(" ", "", schools$NAME)
## fixing individual districts
schools$NAME[schools$NAME == "ESTHERVILLELINCOLNCENTRAL"] <- "ESTHERVILLELINCOLN"
schools$NAME[schools$NAME == "MARIONIND"] <- "MARIONINDEPENDENT"
schools$NAME[schools$NAME == "MARTENSDALEST.MARYS"] <- "MARTENSDALESTMARYS"
schools$NAME[schools$NAME == "RUDDROCKFORDMARBLEROCK"] <- "RUDDROCKFORDMARBLERK"
schools$NAME[schools$NAME == "ST.ANSGAR"] <- "STANSGAR"
schools$NAME[schools$NAME == "WINFIELDMOUNTUNION"] <- "WINFIELDMTUNION"
## standarzing district names in el
el$`District Name` <- toupper(el$`District Name`)
el$`District Name` <- gsub("COMMUNITY SCHOOL DISTRICT", "", el$`District Name`)
el$`District Name` <- gsub("INDEPENDENT SCHOOL DISTRICT", "IND", el$`District Name`)
el$`District Name` <- gsub("COMMUNITY", "", el$`District Name`)
el$`District Name` <- gsub("-", "", el$`District Name`)
el$`District Name` <- gsub(" ", "", el$`District Name`)
## merge by district name
el_test <- schools %>%
left_join(el, by = c("NAME" = "District Name")) %>%
mutate(`Percent EL` = 100 * `Percent EL`)
el_anti <- schools %>%
anti_join(el, by = c("NAME" = "District Name"))
el_test <- el_test %>%
mutate(EL.Bins = factor(ifelse(`Percent EL` < 5,
"< 5%",
ifelse(`Percent EL` >= 5 & `Percent EL` < 15,
"5%-14%",
ifelse(`Percent EL` >= 15 & `Percent EL` < 25,
"15%-24%",
"25+%"))),levels = c("< 5%",
"5%-14%",
"15%-24%",
"25+%")))Methodology
Bottom left: Percent of English Learners by School District, 2019-2020
ggplot(el_test, aes(fill = `EL.Bins`)) +
geom_sf(color = "white", aes(geometry = geometry)) +
theme_map() +
labs(title = "Percent of English Learners by School District, 2019-2020",
subtitle = "Source: Iowa Department of Education") +
scale_fill_brewer(palette = "RdBu",
name = "Percent EL",
na.value = "#B3B3B3",
direction = -1) +
theme(legend.title = element_text(size = 12, face = "bold"),
legend.text = element_text(size = 12),
legend.position = "left")
Excel Calculations & Graphs
Top left: English Learners in Iowa, 2020-2021
EL data was given. Non EL is the total K-12 enrollment in Iowa excluding EL students. Total EL is the total number of EL students enrolled in Iowa. The percentage for total EL students was calculated by taking the total number of EL students and dividing it by the total K-12 enrollment.
Total EL Percent = (Number of EL Students) / (Total K-12)The percentage for non EL students was calculated by taking the number of students who are not an English Learner and dividing by the total K-12 enrollment.
Non EL Percent = (Number of Students Not an EL) / (Total K-12)The female and male counts were given and individually divided by the total EL for percentages.
Female Percent = (Number of EL Female Students) / (Total EL)
Male Percent = (Number of EL Male Students) / (Total EL)
knitr::include_graphics("../docs/articles/images/EL/EL_2.png")
Top right: Percent of English Learners by Race or Ethnicity 2020-2021
EL by race/ethnicity data was given. The percentages created were by dividing the EL Race/Ethnicity count by the total of K-12 EL.
Native American Percent = (EL Native American) / (K-12 EL)
Multi-Race Percent = (EL Multi-Race) / (K-12 EL)
Pacific Islander Percent = (EL Pacific Islander) / (K-12 EL)
White Percent = (EL White) / (K-12 EL)
Asian Percent = (EL Asian) / (K-12 EL)
Black Percent = (EL Black) / (K-12 EL)
Hispanic Percent = (EL HIspanic) / (K-12 EL)The resulting percentages were used as the labels for the graph.
knitr::include_graphics("../docs/articles/images/EL/EL_3.png")
Bottom right: Percent of English Learner with an IEP by Race/Ethnicity 2019-2020
English learners with an Individualized Education Program (IEP) by race/ethnicity were given. English learners by race/ethnicity were given. The percentages show the number of EL students who have an IEP by their race/ethnicity group. To calculate the percentages for each group, divide the number of EL with an IEP for an individual race/ethnic group by the race/ethnic group’s total number of students who are an EL.
Hispanic Percent = (EL with IEP for Hispanic) / (Hispanic EL)
Multi-Race Percent = (EL with IEP for Multi-Race ) / (Multi-Race EL)
White Percent = (EL with IEP for White ) / (White EL)
Native American Percent = (EL with IEP for Native American ) / (Native American EL)
Black Percent = (EL with IEP for Black ) / (Black EL)
Pacific Islander Percent = (EL with IEP for Pacific Islander) / ( Pacific Islander EL)
Asian Percent = (EL with IEP for Asian ) / (Asian EL)
knitr::include_graphics("../docs/articles/images/EL/EL_4.png")