Which Students are Dropping Out of High School?
Dropout_poster.RmdFindings
Dating back to at least the 2015-2016 school year, Iowa students enrolled in IEPs are dtopping out at much higher rates than the rest of the student population. Since 2017, the dropout rates are decreasing for both groups.
Male students accounted for just more than 60% of all IEP dropouts in the 2019-2020 school year.
In the 2019-2020 school year, school districts with larger percentages of students who qualified for free/reduced lunch were positively correlated (0.4) to a larger percentage of students dropping out.
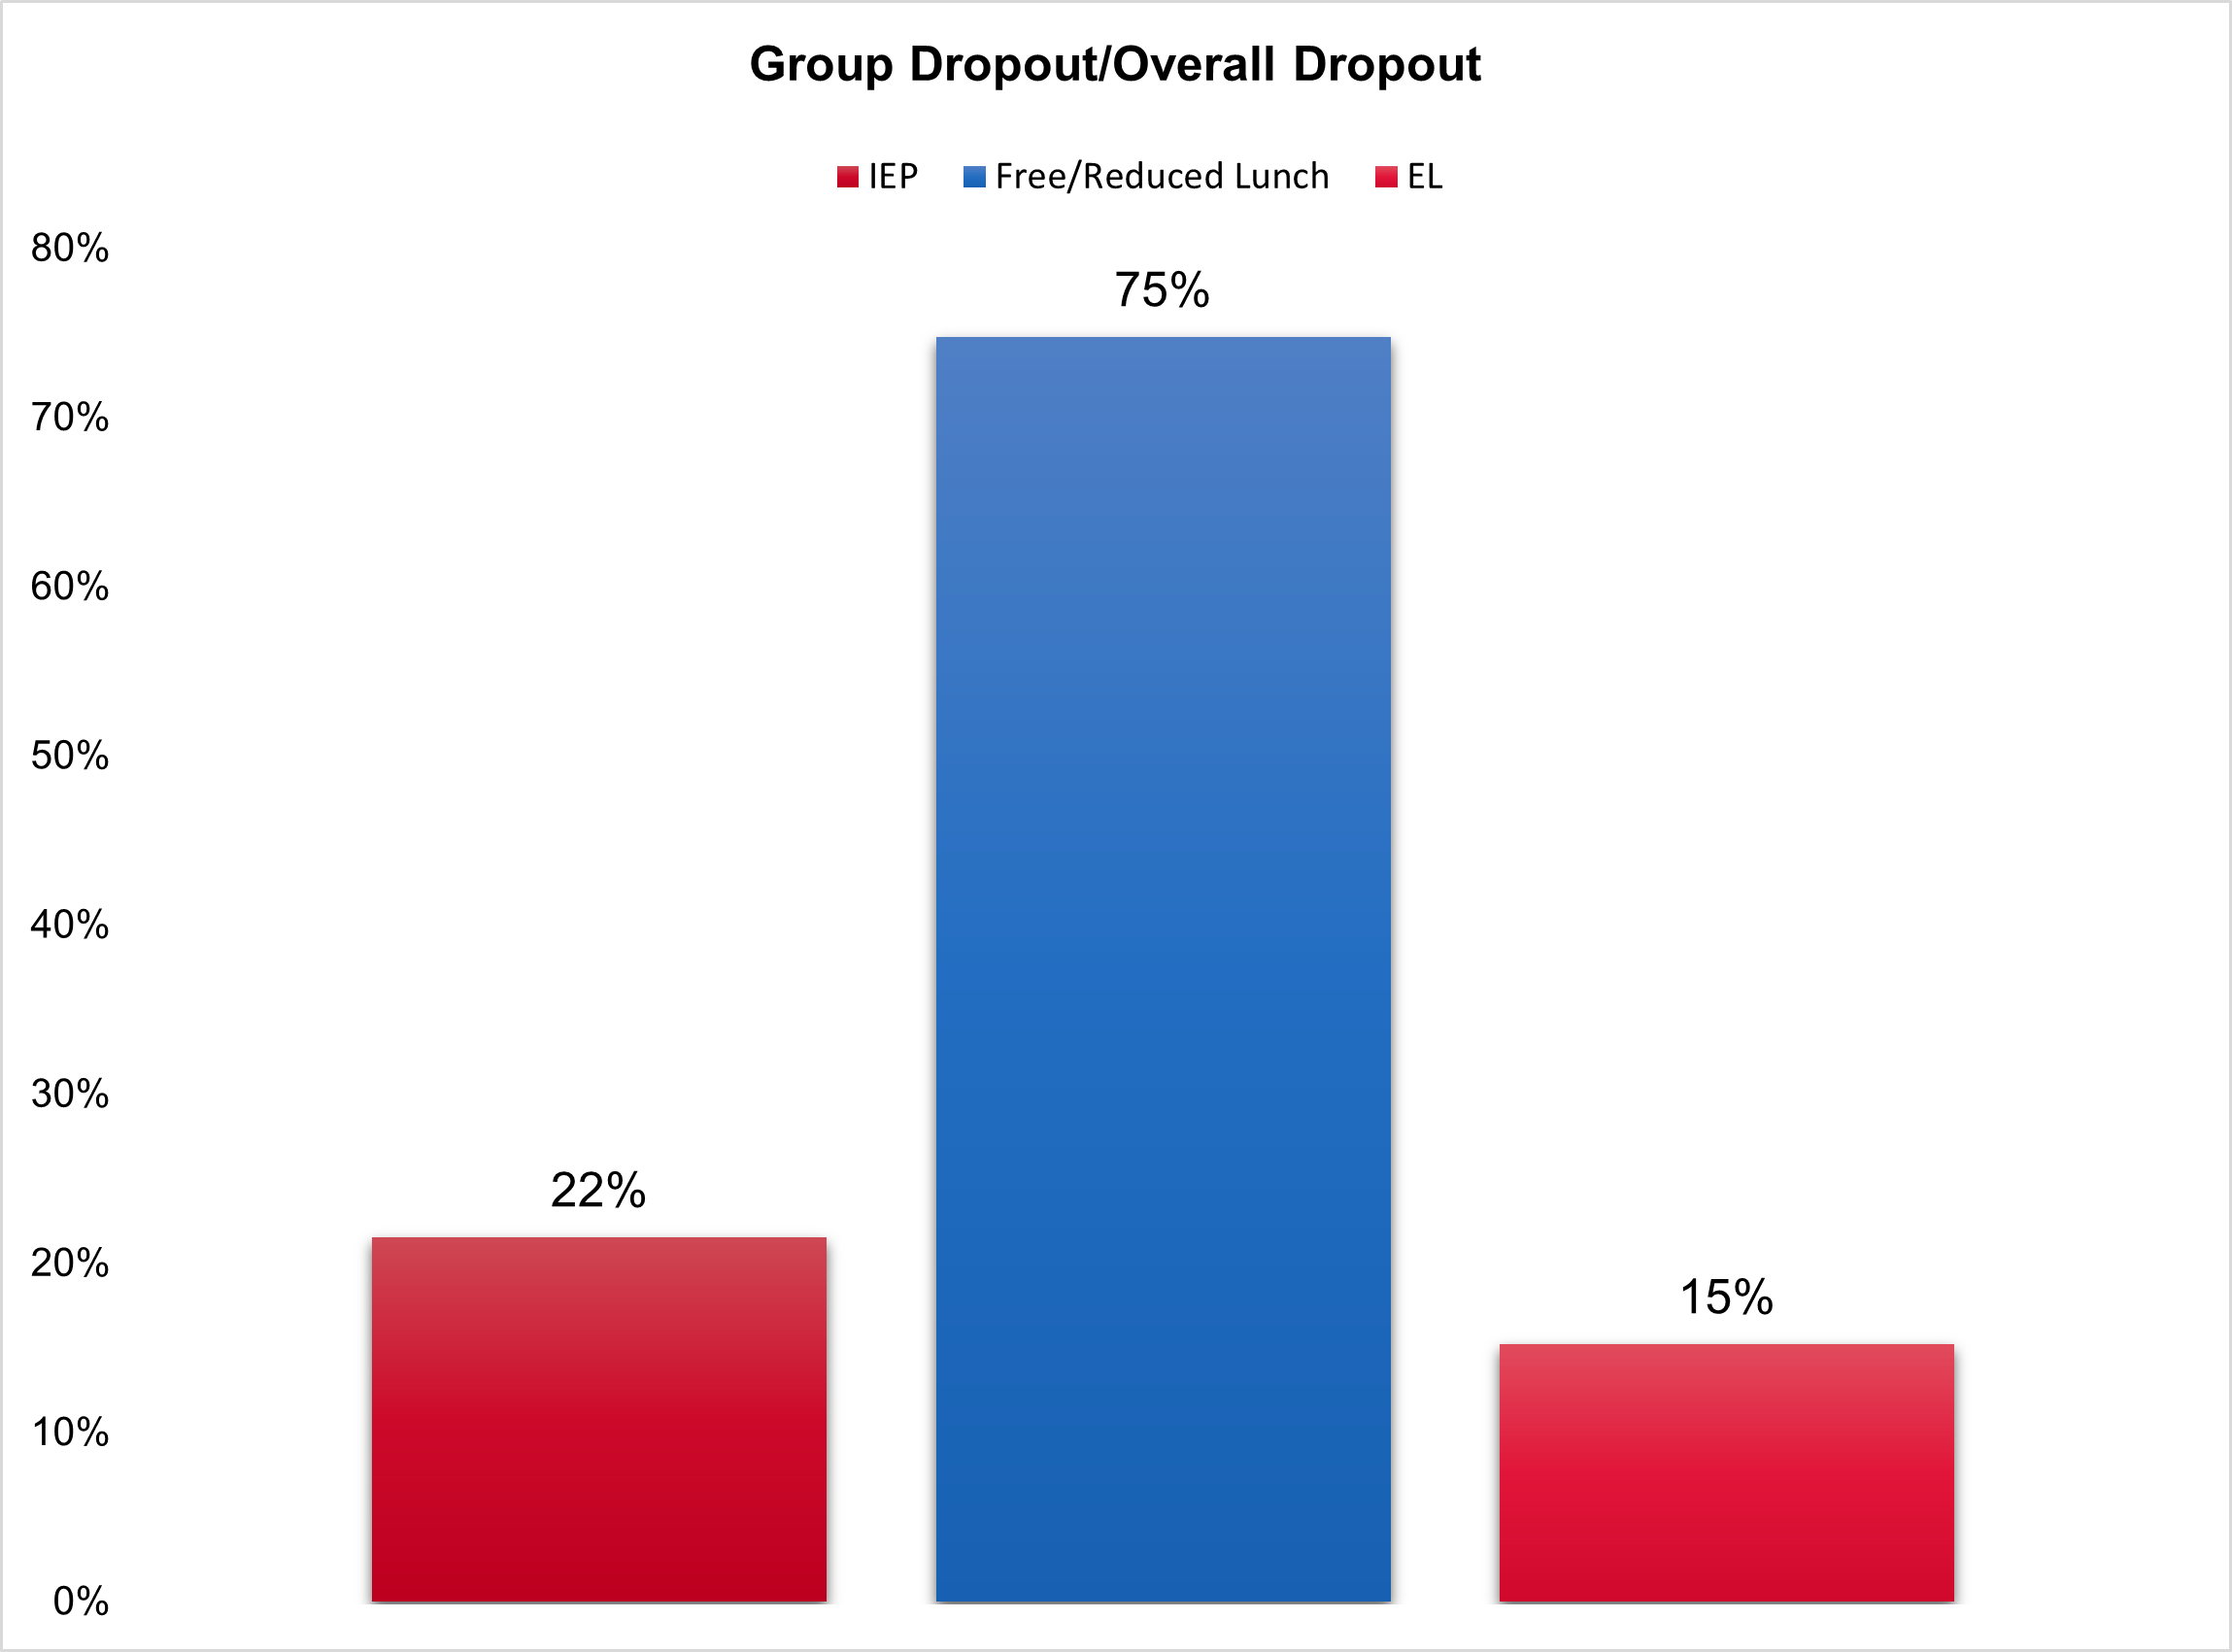
Of all students who dropped out of school during the 2019-2020 school year, 75% were eligible for FRL, 22% were in an IEP, and 15% were EL students.
Data
Sources
- Iowa Public School District Grade 7-12 Dropout Data by subgroup: https://educateiowa.gov/document-type/dropouts-district
Loading in dataset and formatting
ds <- read.csv("../data_clean/dataClean_Dropout_Rates_2015-2020.csv")

vis2 <- ds %>%
  filter(!(is.na(Enrollments)),
         !(is.na(Dropouts)),
         Group %in% c("Overall", "IEP")) %>%
  group_by(Group, Year) %>%
  summarise(Enrollments = sum(Enrollments),
            Dropouts = sum(Dropouts),
            Rate = 100 * (Dropouts / Enrollments))

vis2$Group <- factor(vis2$Group, levels = c("Overall", "IEP"))
vis2$Year <- factor(vis2$Year, levels = c(2015, 2016, 2017, 2018, 2019, 2020))
Methodology
Top left: Percent of Students with IEPs Dropping out of School Compared to the Dropout Rate of All Students, 2015-2020
ggplot(vis2, aes(x = Year, y = Rate, fill = Group)) +
  geom_col(position = "dodge", color = "black") +
  theme_minimal() +
  labs(title = "Percent of Students with IEPs Dropping out of School Compared to the Dropout Rate of All Students, 2015-2020",
       subtitle = "Source: Iowa Department of Education") +
  theme(axis.title.x = element_text(face = "bold",
                                    size = 11),
        axis.title.y = element_text(face = "bold",
                                    margin = margin(r = 10),
                                    size = 11,
                                    angle = 0,
                                    vjust = .5),
        axis.text.y = element_text(face = "bold",
                                   angle = 0,
                                   size = 11),
        axis.text.x = element_text(face = "bold",
                                   size = 11),
        legend.title = element_blank(),
        legend.text = element_text(size = 11),
        title = element_text(size = 10, face = "bold")) +
  scale_fill_manual(values = c("#2A6EBB", "#D81E3F")) +
  scale_y_continuous(breaks = c(0, 1, 2, 3, 4),
                     labels = c("0%", "1%", "2%", "3%", "4%"),
                     limits = c(0,4)) +
  geom_text(aes(label= round(Rate, digits = 2)), position=position_dodge(width=0.9), vjust=-0.25)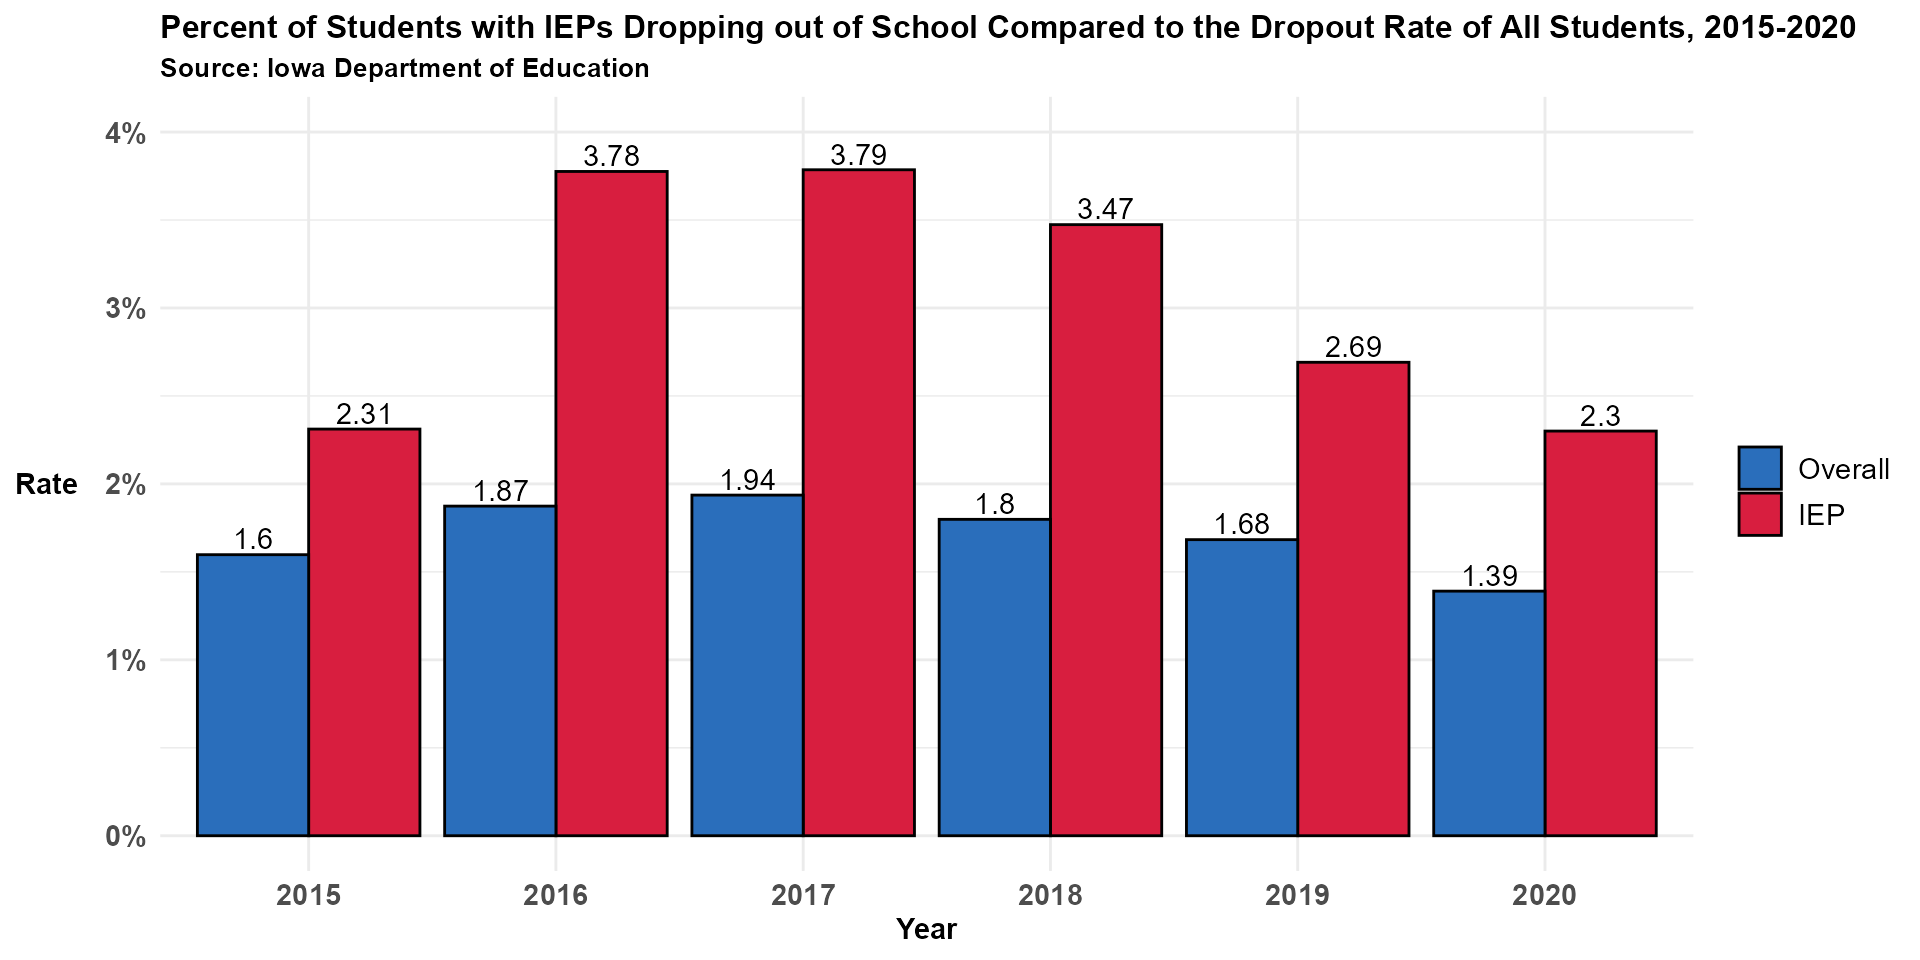
Excel Calculations & Graphs
Top right: Percent of High School Students Dropping out of School by Sex, 2019-2020
Drop out numbers were given. To calculate percentage of females dropping out, divide the dropout count for females by the overall dropout count.
Female Dropout Rate = Number of Female Dropout Students / Total DropoutsTo calculate percentage of males dropping out, divide the dropout count for males by the overall dropout count.
Male Dropout Rate = Number of Male Dropout Students / Total Dropouts
knitr::include_graphics("../docs/articles/images/Dropouts/Dropouts_2.png")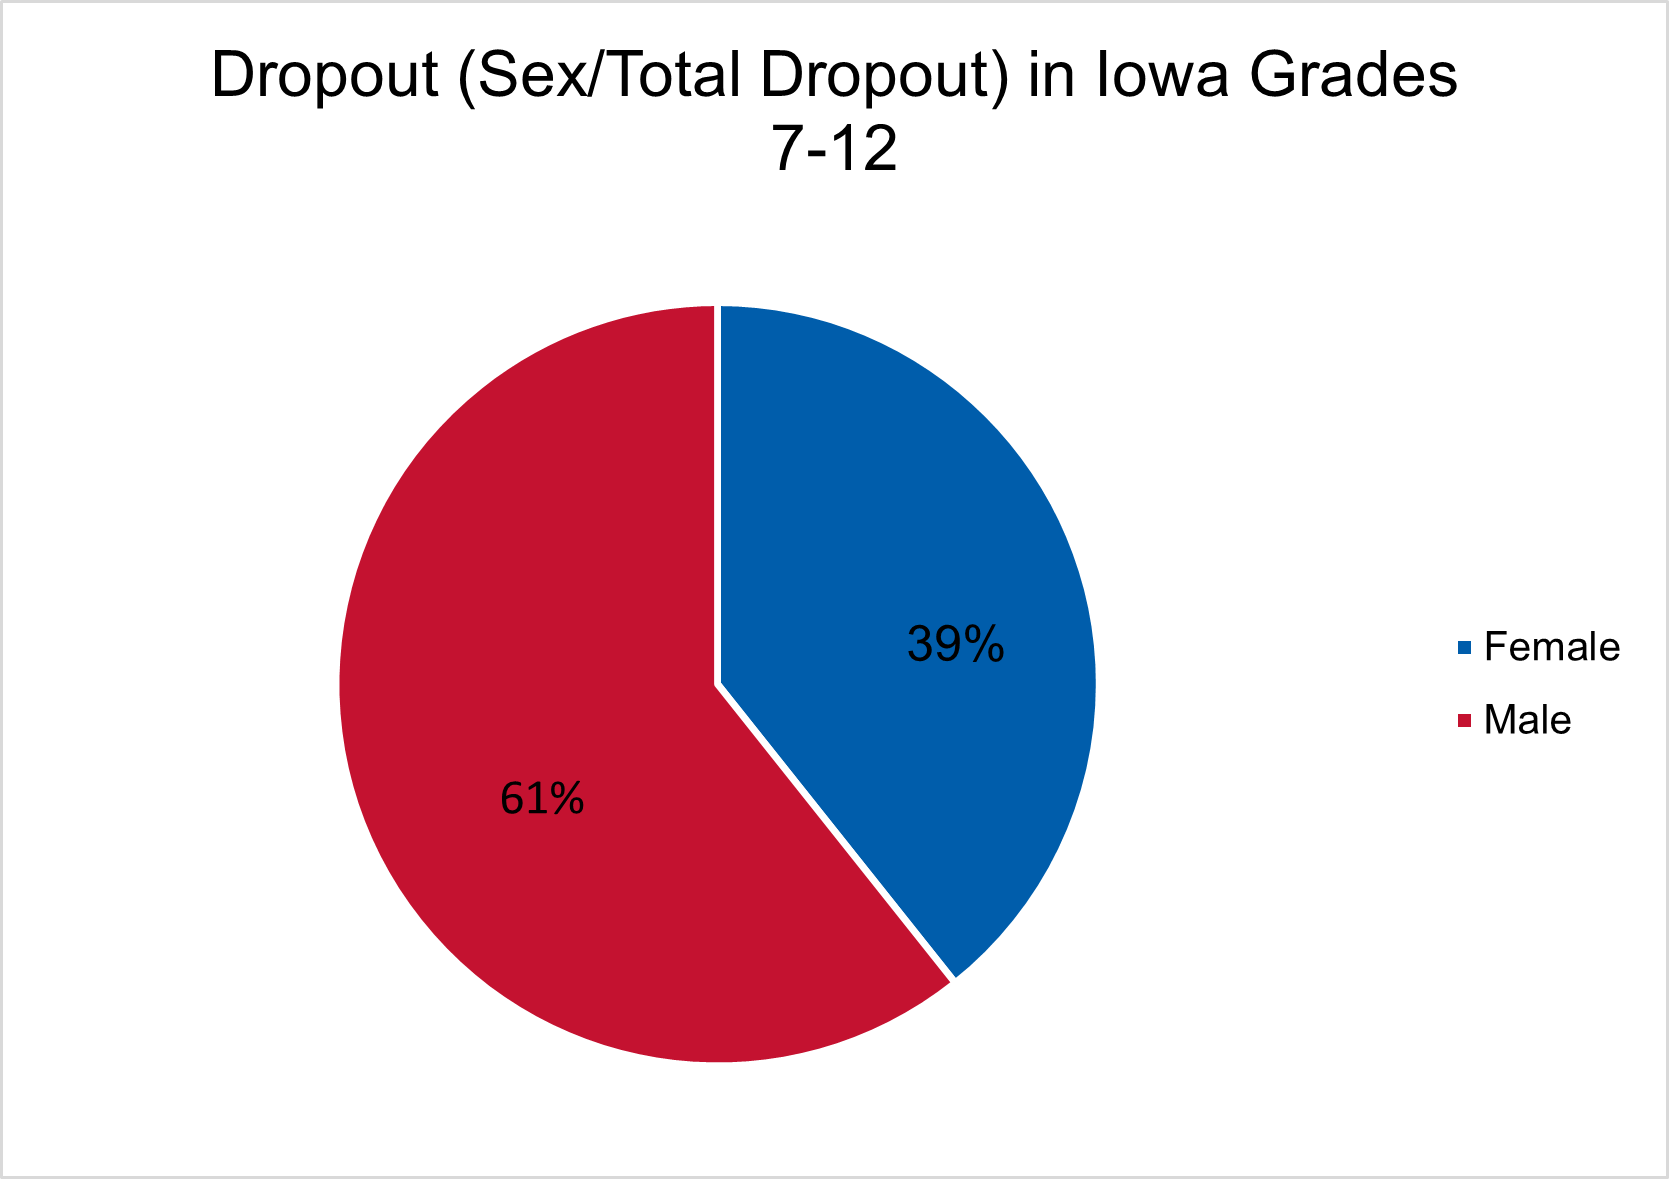
Bottom left: Percent Dropout Rate by Percent Free/Reduced Lunch Students in Iowa by School District, 2019-2020
The scatter plot below was calculated to find a correlation between the free/reduced lunch rate and dropout rate. To calculate free/reduced lunch rate divide the number of students who qualify for Free or Reduced Lunch divided by the total K-12 enrollment for each district. To calculate Dropout Rate, divide number of dropout students by total number of 7-12 enrolled for each district.
FRL Rate per District = Number of FRL Students / (K−12 Enrollment)Dropout Rate per District = Number of Dropout Students / (Total 7−12 Enrollment)
knitr::include_graphics("../docs/articles/images/Dropouts/Dropouts_3.png")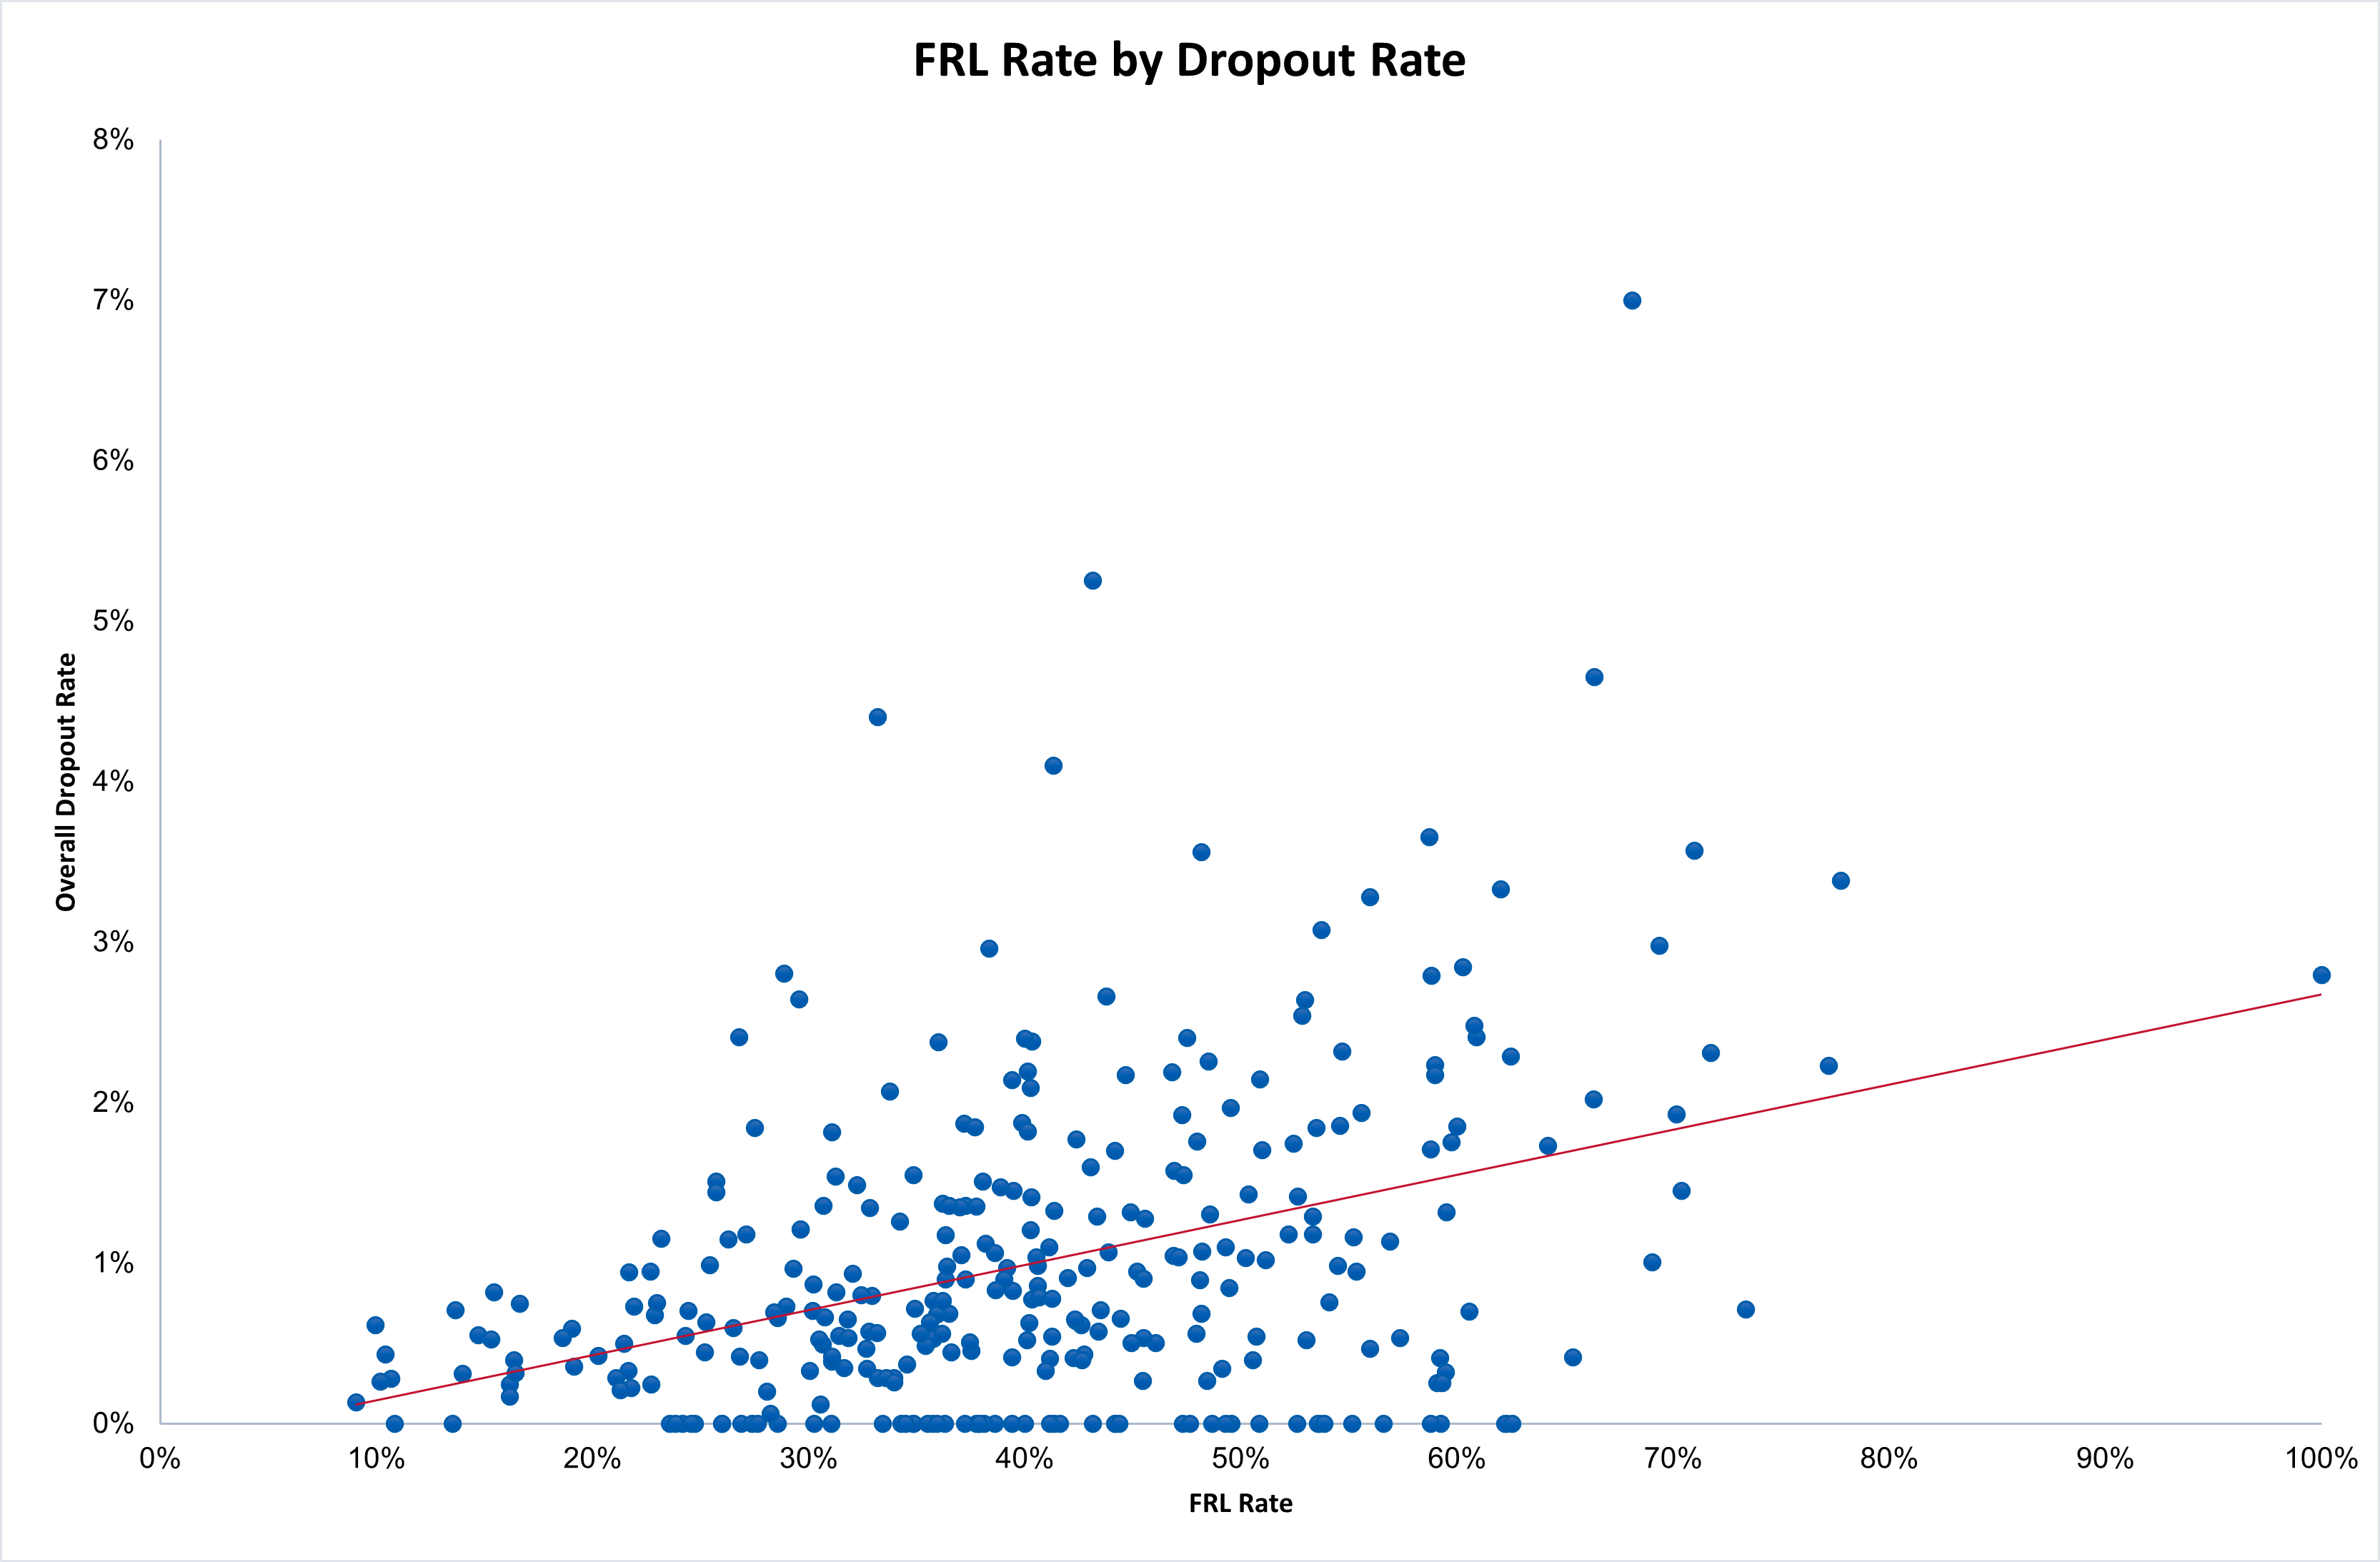
Bottom right: Percent of Dropouts by Type of School Program, 2019-2020
Dropout data was given. To calculate IEP percentage, divide the number of IEP students who dropped out by the overall dropout rate.
IEP Percent = Number of IEP Dropout Students / Total DropoutsFor Free/Reduced Lunch (FRL), divide the FRL dropout count by the overall dropout rate.
FRL Percent = Number of FRL Dropout Students / Total DropoutsFor English Learners (EL formerly ELL), divide the English Learner dropout count by the overall count.
EL Percent = Number of EL Dropout Students / Total Dropouts
knitr::include_graphics("../docs/articles/images/Dropouts/Dropouts_4.png")