Which Students are Receiving IEPs in Iowa?
IEP_poster.RmdIn Iowa, Individualized Education Programs (IEPs) is an individualized plan that provides achievable goals and is developed in collaboration with parents and a team for a child with a disability.
Findings
In the 2020-2021 school year, male students received almost twice the amount of IEPs as female students. Our findings also show that the percent of students with an IEP are higher for Native American and Black students, while Asian students have the lowest percent. Both trends are consistent for the past 7 school years.
Native American and Black students have the highest percentage of IEPs for all students. Asian students have the lowest percent of students with IEPs
Even though socio-economic status isn’t criteria for getting an IEP, the table above shows a moderate positive correlation (.385) between percent of students with an IEP and the percent of students eligible for Free/Reduced Lunch in Iowa’s public school districts. This positive relationship is shown by the scatter plot to the left.
Percent of students with an IEP is about 1% higher for school districts in an urban city compared to a more rural setting.
The percent of students with an IEP and on FRL is 15% higher than the overall student population.
Data
Sources:
IEP Enrollment by District, Age Group, Grade, Race and Gender: https://educateiowa.gov/document-type/special-education-iep-enrollment
IEPs by Free/Reduced Lunch 2014-2021: Data Request
Urban/Rural Classification Data: 2019 Estimated City Population from the US Census Bureau Population Estimates Program
Loading, joining, and cleaning data
##----load-in-packages--------------------------------------------------------------
library(tidycensus)
#> Warning: package 'tidycensus' was built under R version 4.0.5
library(tidyverse)
#> Warning: package 'tidyverse' was built under R version 4.0.3
#> Warning: package 'ggplot2' was built under R version 4.0.5
#> Warning: package 'tibble' was built under R version 4.0.3
#> Warning: package 'tidyr' was built under R version 4.0.3
#> Warning: package 'readr' was built under R version 4.0.3
#> Warning: package 'purrr' was built under R version 4.0.3
#> Warning: package 'dplyr' was built under R version 4.0.3
library(tigris)
#> Warning: package 'tigris' was built under R version 4.0.5
library(mapview)
#> Warning: package 'mapview' was built under R version 4.0.5
library(leafsync)
#> Warning: package 'leafsync' was built under R version 4.0.5
library(leaflet)
#> Warning: package 'leaflet' was built under R version 4.0.5
library(plotly)
#> Warning: package 'plotly' was built under R version 4.0.4
library(stringr)
library(readxl)
#> Warning: package 'readxl' was built under R version 4.0.3
library(data.table)
#> Warning: package 'data.table' was built under R version 4.0.3
library(ggplot2)
library(janitor)
#> Warning: package 'janitor' was built under R version 4.0.5
library(dplyr)
library(ggthemes)
#> Warning: package 'ggthemes' was built under R version 4.0.5
library(colorspace)
#> Warning: package 'colorspace' was built under R version 4.0.3
library(xfun)
#> Warning: package 'xfun' was built under R version 4.0.5
options(scipen = 10000)
##----load-in-data----------------------------------------------------------------------
load(file = "../data_clean/all_IEP_data.rda")
load(file = "../data_clean/all_enrollment_demographics_7year.rda")
load("../data_clean/Free-Reduced-Lunch_IEP_data_2021.rda")
load("../data_clean/urban_classifications.Rda")
##----clean-IEP-column-names-------------------------------------------------------------
IEP_data <- all_data %>%
clean_names()
##----select-important-columns-from-enrollment-data--------------------------------------
enrollment_races <- all_enrollment %>%
select(district_number, district_name, year, hispanic_total, native_american_total, asian_total, black_total,
pacific_islander_total, white_total, multi_race_total)
##----join-IEP_data-with-enrollment_races------------------------------------------------
all_race_data <- left_join(IEP_data, enrollment_races, by = c("district_number", "year"))
##----creating-race-proportions-for-line-graph--------------------------------------------------
race_props <- all_race_data %>%
group_by(year) %>%
summarize(hispanic_prop = (sum(hispanic, na.rm = TRUE)/sum(hispanic_total, na.rm = TRUE))*100,
native_american_prop = (sum(native_american, na.rm = TRUE)/sum(native_american_total, na.rm = TRUE))*100,
asian_prop = (sum(asian, na.rm = TRUE)/sum(asian_total, na.rm = TRUE))*100,
black_prop = (sum(black, na.rm = TRUE)/sum(black_total, na.rm = TRUE))*100,
pacific_islander_prop = (sum(pacific_islander, na.rm = TRUE)/sum(pacific_islander_total, na.rm = TRUE))*100,
white_prop = (sum(white, na.rm = TRUE)/sum(white_total, na.rm = TRUE))*100,
multi_race_prop = (sum(two_or_more_races, na.rm = TRUE)/sum(multi_race_total, na.rm = TRUE))*100)
##----creating-sex-data-frame-------------------------------------------------------------------
sex_enrollment <- all_enrollment %>%
select(district_name, year, total_male, total_female)
##----combining-enrollment-data-with-IEP-data-for-sex-------------------------------------------
all_sex_data <- left_join(IEP_data, sex_enrollment, by = c("district_name", "year"))
cleaned_sex_data <- all_sex_data[!is.na(all_sex_data$total_male), ] #removing rows with NAs
##----add-proportion/pct-columns----------------------------------------------------------------
sex_props <- cleaned_sex_data %>%
group_by(year) %>%
summarize(male_prop = (sum(male)/sum(total_male))*100,
female_prop = (sum(female)/sum(total_female))*100)
sex_long <- gather(sex_props, variable,value, -year)
sex_long$variable = factor(sex_long$variable, levels = c("female_prop", "male_prop"),
labels = c("Female", "Male"))
##----extract-iep-data-for-year-2021---------------------------------------------------------
iep_data_2021 <- IEP_data %>%
select(county, district_number, district_name, year, all_students, all_iep_students) %>%
filter(year == 2021)
##----join-FRL-with-IEP-data------------------------------------------------------------------
FRL_IEP_combined <- left_join(iep_data_2021, FRL_IEP_data, by = "district_number")
##----cleaning-up-combined-FRL-rows------------------------------------------------------------
cleaned_FRL_IEP_data <- FRL_IEP_combined[!grepl("<=10", FRL_IEP_combined$frl_with_iep),]
cleaned_FRL_IEP_data <- cleaned_FRL_IEP_data[-240,]
##----alternate-method-to-deal-with-problematic-rows-----------------------------------------
FRL_IEP_combined$frl_with_iep <- str_replace(FRL_IEP_combined$frl_with_iep, "<=10", "10")
FRL_IEP_combined$frl_with_iep <- str_replace(FRL_IEP_combined$frl_with_iep, ">=10", "10")
##----fix-data-types-of-columns-in-cleaned_FRL_IEP_data----------------------------------------
class(cleaned_FRL_IEP_data$frl_with_iep) = "numeric"
class(cleaned_FRL_IEP_data$frl_total) = "numeric"
class(FRL_IEP_combined$frl_with_iep) = "numeric"
class(FRL_IEP_combined$frl_total) = "numeric"
##----add-columns-calculating-proportions-for-FRL-data-----------------------------------------
FRL_summarized <- FRL_IEP_combined %>%
summarize(avg_frl_iep = (sum(frl_with_iep)/sum(all_iep_students))*100,
avg_frl_overall = (sum(frl_total)/sum(all_students))*100)
##----creating-proportions-columns-for-scatter-plot---------------------------------------------
total_prop_data <- FRL_IEP_combined %>%
mutate(iep_proportion = (all_iep_students/all_students)*100,
frl_proportion = (frl_total/all_students)*100)
##----taking-out-a-row-that-makes-no-sense------------------------------------------------------
total_prop_data <- total_prop_data[-227,]
##----merging-rural-urban-to-FRL_IEP-data-------------------------------------------------------
class(total_prop_data$district_number) = "numeric"
totals_frl_iep <- left_join(total_prop_data, filtered_rur, by = c("district_number" = "DE_DIST"))
##----changing-classification-categories-to-population-intervals--------------------------------
totals_frl_iep <- totals_frl_iep %>%
mutate(category = ifelse(totals_frl_iep$classification == "Rural", "Under 500",
ifelse(totals_frl_iep$classification == "Rural Plus", "500 - 2,499",
ifelse(totals_frl_iep$classification == "Urban Cluster", "2,500 - 9,999",
ifelse(totals_frl_iep$classification == "Micropolitan", "10,000 - 24,999", "Over 25,000")))))
##----add-columns-calculating-proportions-for-FRL-data-----------------------------------------
FRL_summarized <- FRL_IEP_combined %>%
summarize(avg_frl_iep = (sum(frl_with_iep)/sum(all_iep_students))*100,
avg_frl_overall = (sum(frl_total)/sum(all_students))*100)
FRL_summary_long <- gather(FRL_summarized, variable, value)
##---re-labeling-categories-for-IEP/FRL-bar-----------------------------------------------------
FRL_summary_long$variable = factor(FRL_summary_long$variable, levels = c("avg_frl_iep", "avg_frl_overall"),
labels = c("IEP Students", "All Students"))
##----summarizing-iep-data-for-bar-graph--------------------------------------------------------
iep_summed <- totals_frl_iep %>%
group_by(category) %>%
summarize(proportion = (sum(all_iep_students)/sum(all_students))*100)
##----making calculations-for-race-bar-graph----------------------------------------------------
race_props_summarized <- all_race_data %>%
filter(year == 2021) %>%
summarize(black_prop = (sum(black)/sum(black_total))*100,
native_american_prop = (sum(native_american)/sum(native_american_total))*100,
asian_prop = (sum(asian)/sum(asian_total))*100,
hispanic_prop = (sum(hispanic)/sum(hispanic_total))*100,
two_or_more_races_prop = (sum(two_or_more_races)/sum(multi_race_total))*100,
pacific_islander_prop = (sum(pacific_islander)/sum(pacific_islander_total))*100,
white_prop = (sum(white)/sum(white_total))*100)
##---put-summarized-data-into-long-format-------------------------------------------------------
race_props_long <- gather(race_props_summarized, variable,value)
race_props_long$variable <- factor(race_props_long$variable,
levels = c("native_american_prop", "black_prop",
"two_or_more_races_prop",
"hispanic_prop", "white_prop",
"pacific_islander_prop", "asian_prop"),
labels = c("Native American", "Black", "Multiple Races",
"Hispanic", "White", "Pacific Islander", "Asian"))
race_props_long <- within(race_props_long,
variable <- factor(variable,
levels=names(sort(table(variable),
decreasing=TRUE))))
##----grabbing-tigris-shape-data-for-race-graphs------------------------------------------------
ia_schools <- school_districts("Iowa", year = 2020)
##----creating-props-for-iep-graph--------------------------------------------------------------
iep_2021_props <- iep_data_2021 %>%
mutate(proportion = (all_iep_students/all_students)*100)
##----sorting-school-districts-alphabetically---------------------------------------------------
sorted_ieps <- iep_2021_props %>%
arrange(district_name)
sorted_ia_schools <- ia_schools %>%
arrange(NAME)
##----adding-ids-to-sorted-data-sets------------------------------------------------------------
ieps_with_ids <- sorted_ieps %>%
mutate(id = 1:327)
ia_schools_with_ids <- sorted_ia_schools %>%
mutate(id = 1:327)
##----join-race-data-with-school-district-geometry----------------------------------------------
map_iep_data <- inner_join(ia_schools_with_ids, ieps_with_ids, by = 'id')
##----creating-bins-for-IEP-proportion-scale-on-map---------------------------------------------
iep_map2 <- map_iep_data %>%
mutate(prop_bins = ifelse(map_iep_data$proportion < 10, "< 10%",
ifelse(map_iep_data$proportion < 15, "10%-15%",
ifelse(map_iep_data$proportion < 20, "15%-20%", "20+%"))))Methodology
IEPs by Race Line Graph
colors = c("Black" = "#a6cee3", "Asian" = "#1f78b4", "Hispanic" = "#b2df8a", "Multiple Races" = "#33a02c", "White" = "#fb9a99", "Native American" = "#e31a1c", "Pacific Islander" = "#fdbf6f")
iep_race_line_graph <- ggplot(race_props, aes(x = year)) +
geom_line(aes(y = black_prop, color = "Black"), size = 1.2) +
geom_line(aes(y = asian_prop, color = "Asian"), size = 1.2) +
geom_line(aes(y = hispanic_prop, color = "Hispanic"), size = 1.2) +
geom_line(aes(y = multi_race_prop, color = "Multiple Races"), size = 1.2) +
geom_line(aes(y = white_prop, color = "White"), size = 1.2) +
geom_line(aes(y = native_american_prop, color = "Native American"), size = 1.2) +
geom_line(aes(y = pacific_islander_prop, color = "Pacific Islander"), size = 1.2) +
labs(title = "Proportion of IEPs by Race in Iowa",
subtitle = "Source: Department of Education Data 2015-2021",
x = "Year",
y = "Proportion",
color = "Race") +
scale_colour_manual(values = colors) +
theme_minimal()
iep_race_line_graph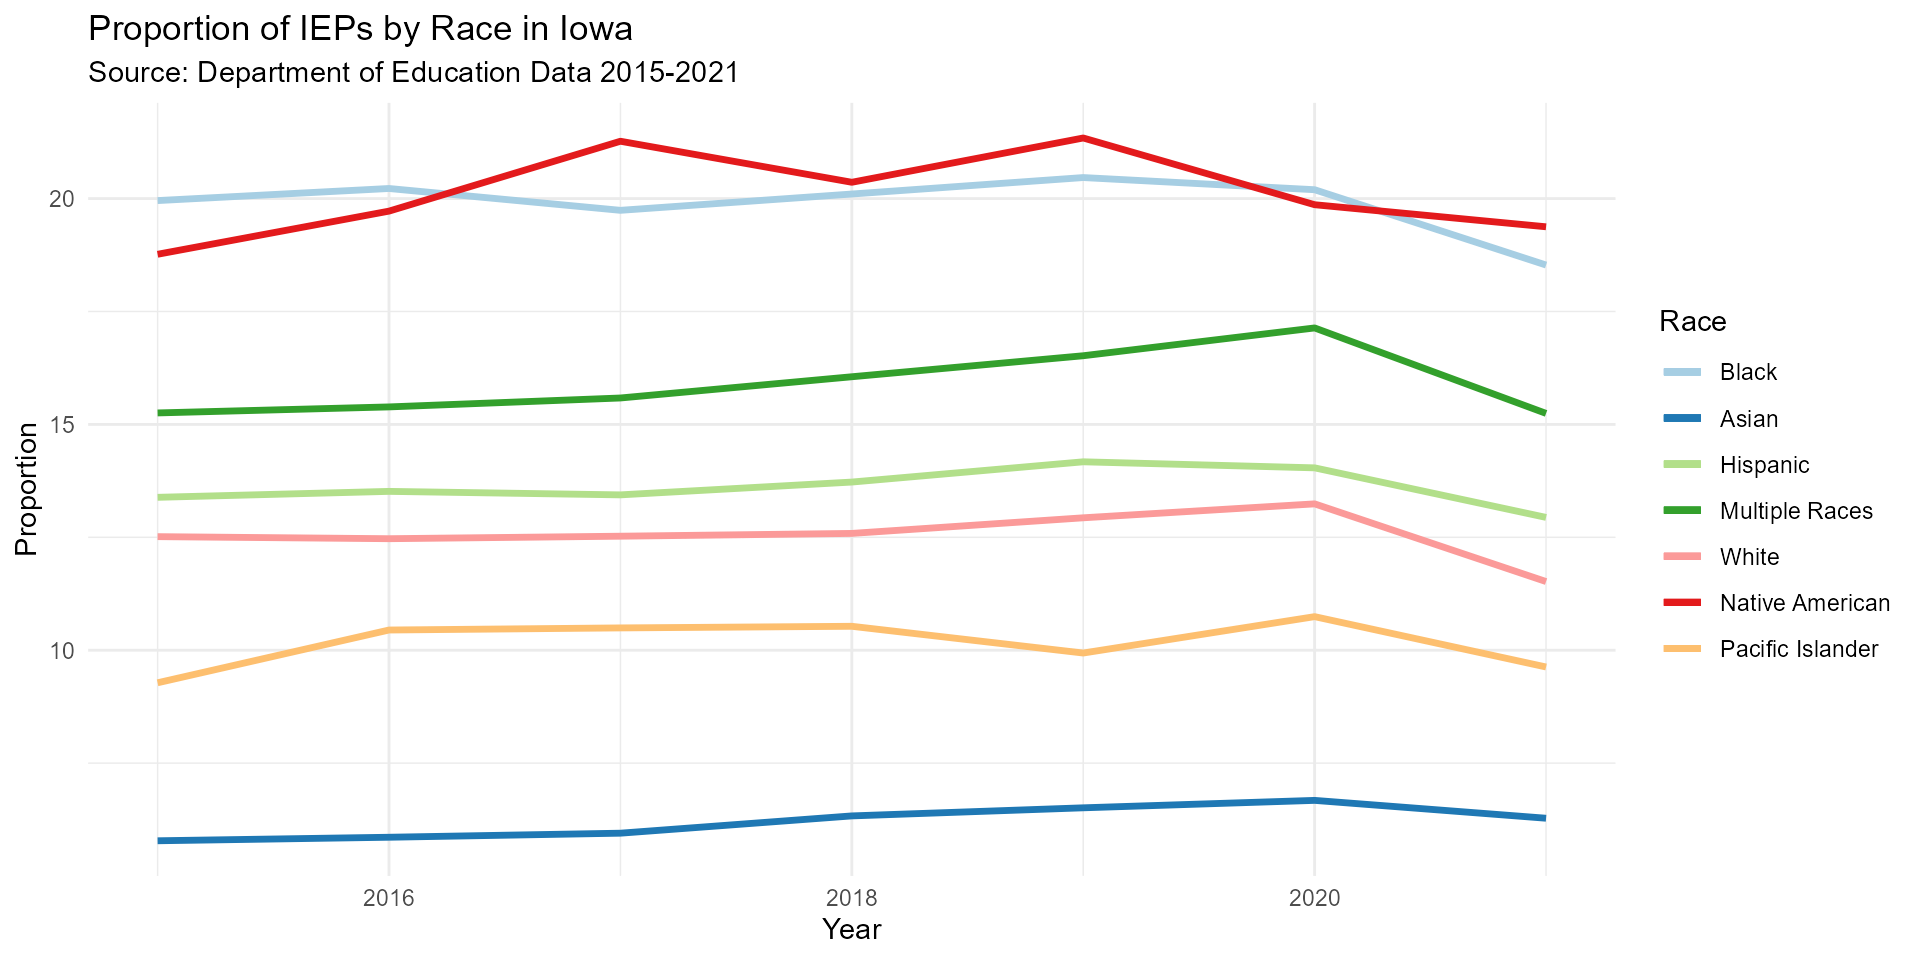
Percent of students with an IEP by Sex
sex_pie_graph <- sex_long %>%
filter(year == 2021) %>%
ggplot(aes(fill = variable, x ="", y = value)) +
geom_bar(stat = "identity", width = 1) +
labs(title = "Proportion of IEPs in Iowa by Sex in 2021",
subtitle = "Source: Department of Education Data",
x = "",
y = "",
fill = "Sex") +
coord_polar("y", start=0) +
theme_void() +
scale_fill_manual(values = c("#d81e3f", "#2a6ebb"))
sex_pie_graph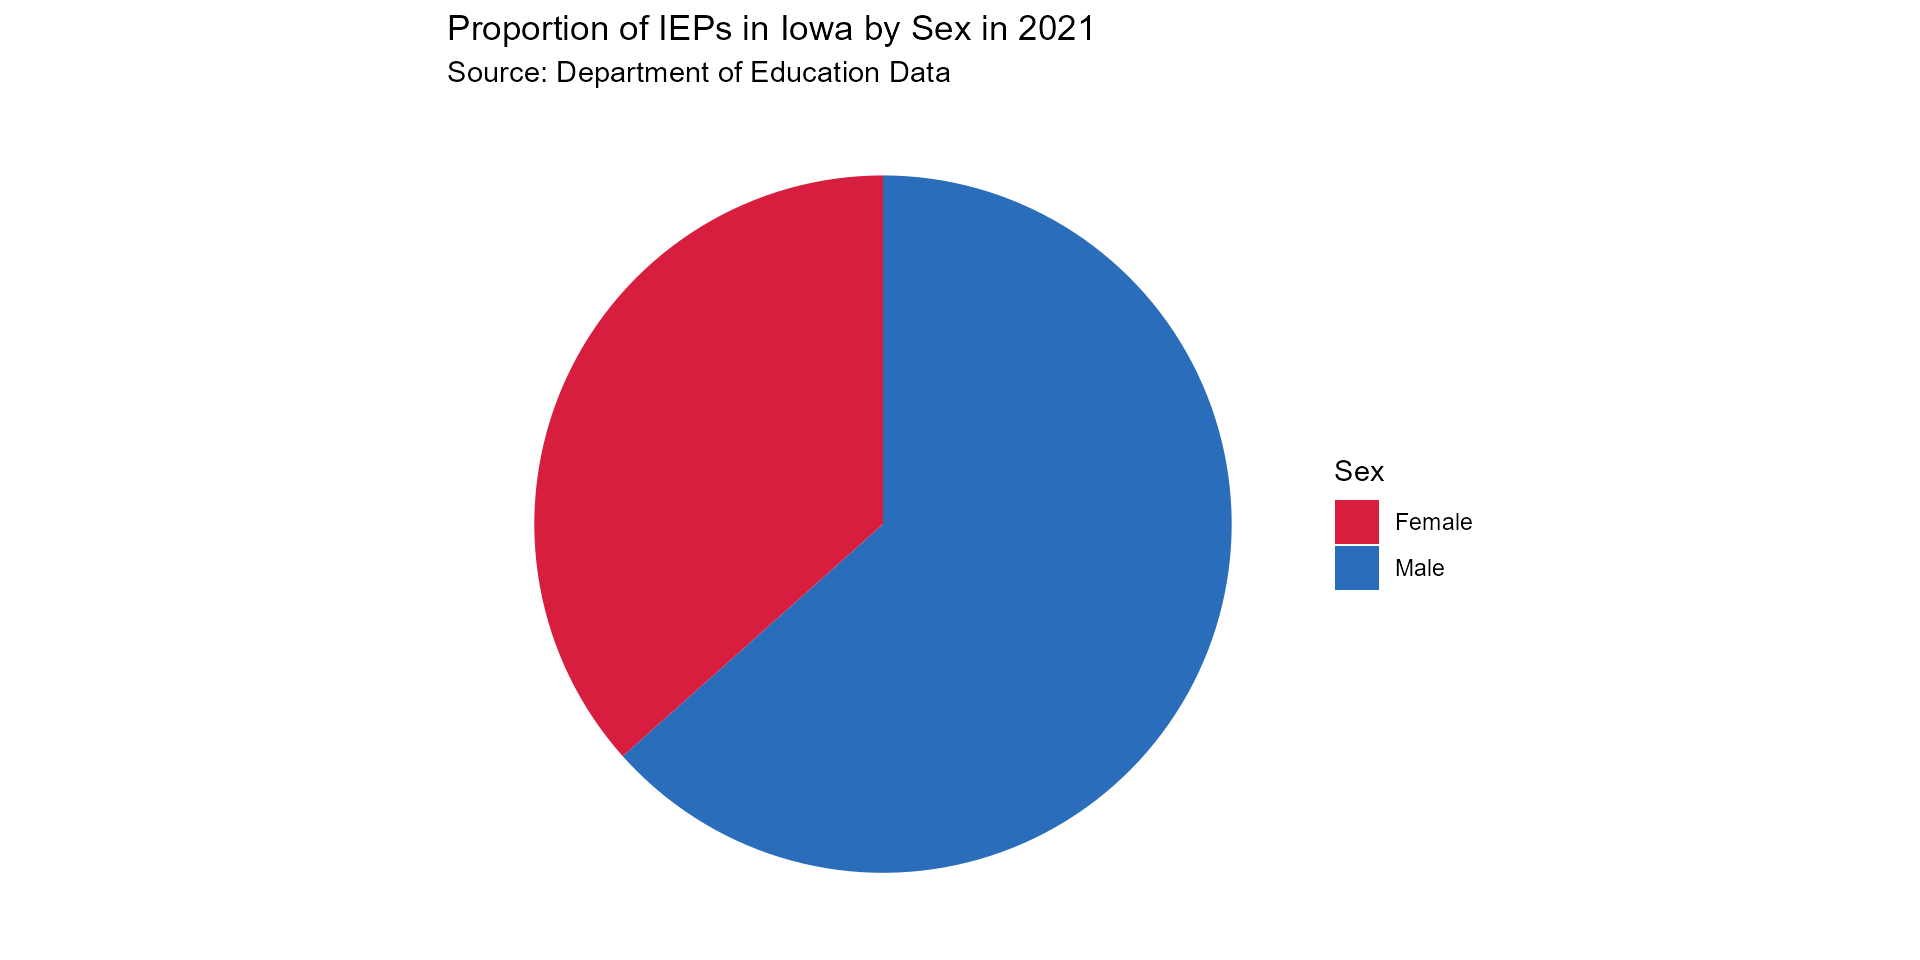
FRL / IEP scatterplot w/ urban-rural classifications
scatter_FRL_IEP <- totals_frl_iep %>% mutate(category = fct_relevel(category,
"Over 25,000", "10,000 - 24,999", "2,500 - 9,999",
"500 - 2,499", "Under 500")) %>%
ggplot(aes(y = iep_proportion, x = frl_proportion, color = category)) +
geom_point() +
labs(title = "School Districts in Iowa by Proportion Enrolled in IEPs and Free/Reduced Lunch",
subtitle = "Source: 2021 Department of Education Data",
y = "Proportion of Students in IEP",
x = "Proportion of Students Eligible for Free/Reduced Lunch",
color = "Population") +
scale_colour_manual(values = c("#2a6ebb","#8cb1da","#c9c9c9","#f1b0bc","#e35c74", "#d81e3f")) +
theme_minimal()
scatter_FRL_IEP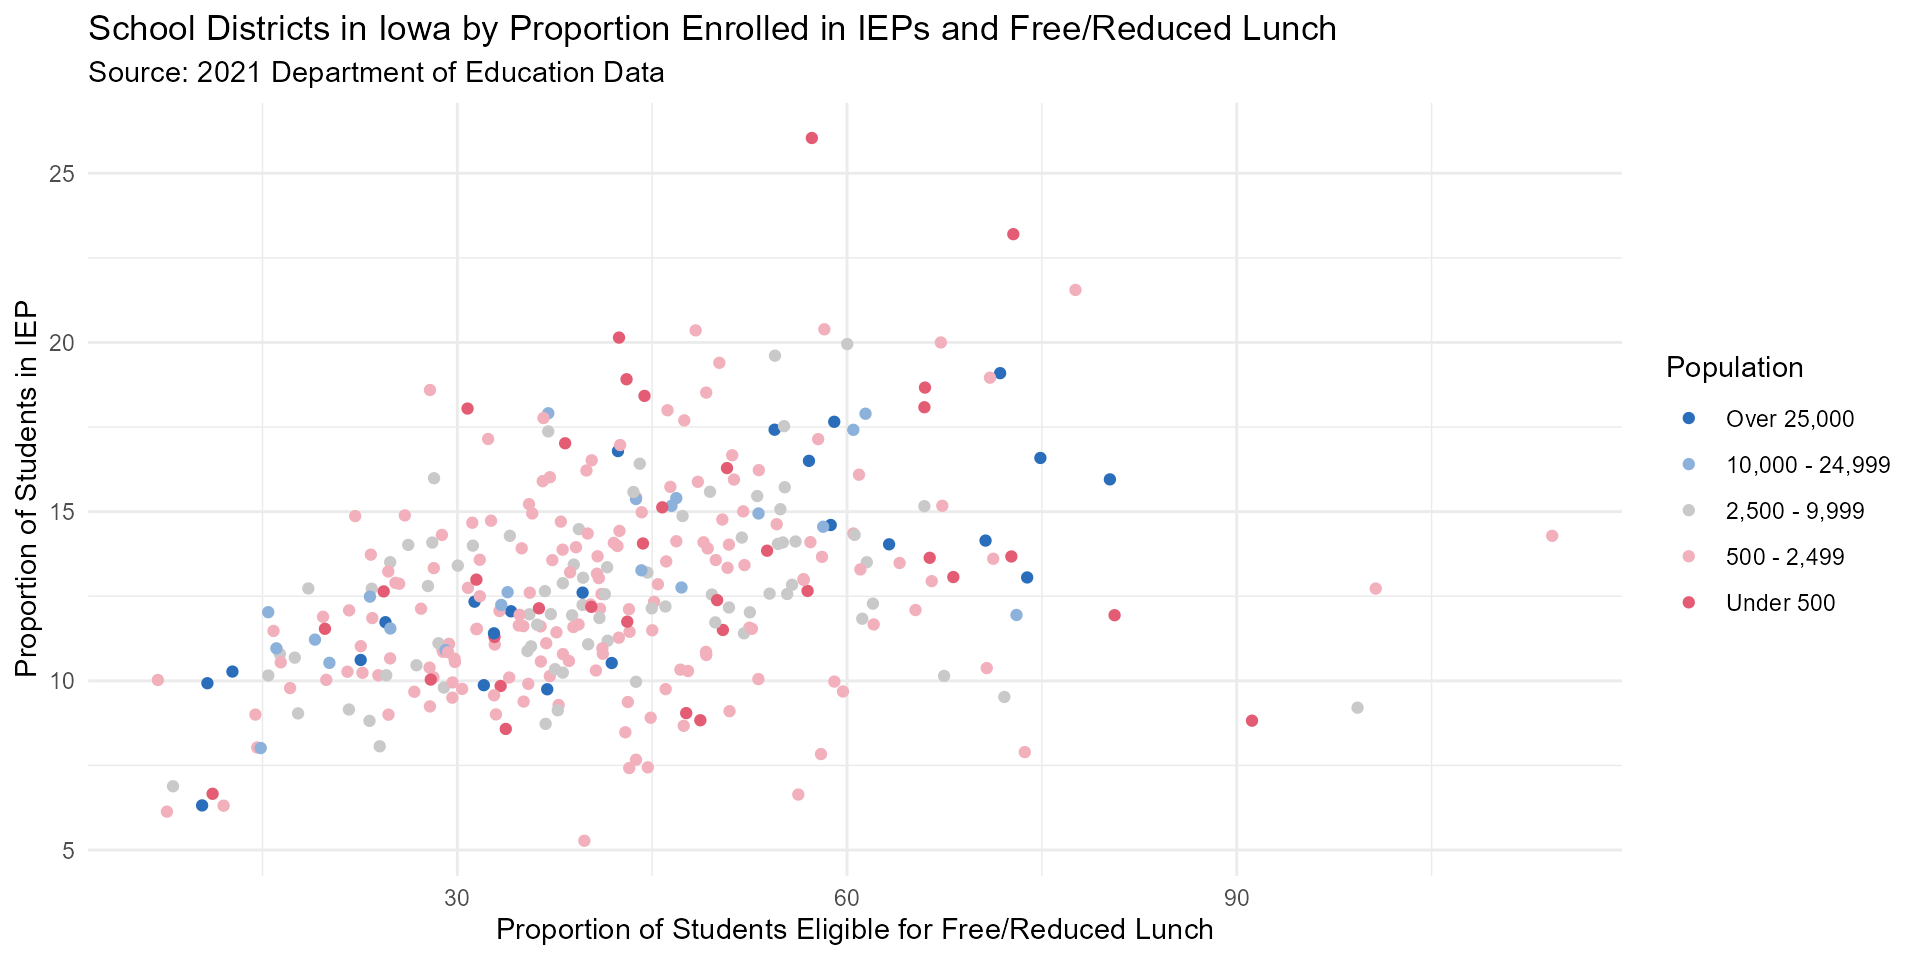
IEP Students vs. All Students FRL Proportion Bar Graph
FRL_bar_graph <- FRL_summary_long %>%
ggplot(aes(x = variable, y = value)) +
geom_bar(position = "dodge", stat = "identity", fill = "#2A6EBB") +
labs(title = "Proportion of Students Eligible for Free/Reduced Lunch in Iowa by IEP Status",
subtitle = "Source: 2021 Department of Education Data",
x = "",
y = "Proportion") +
theme_minimal()
FRL_bar_graph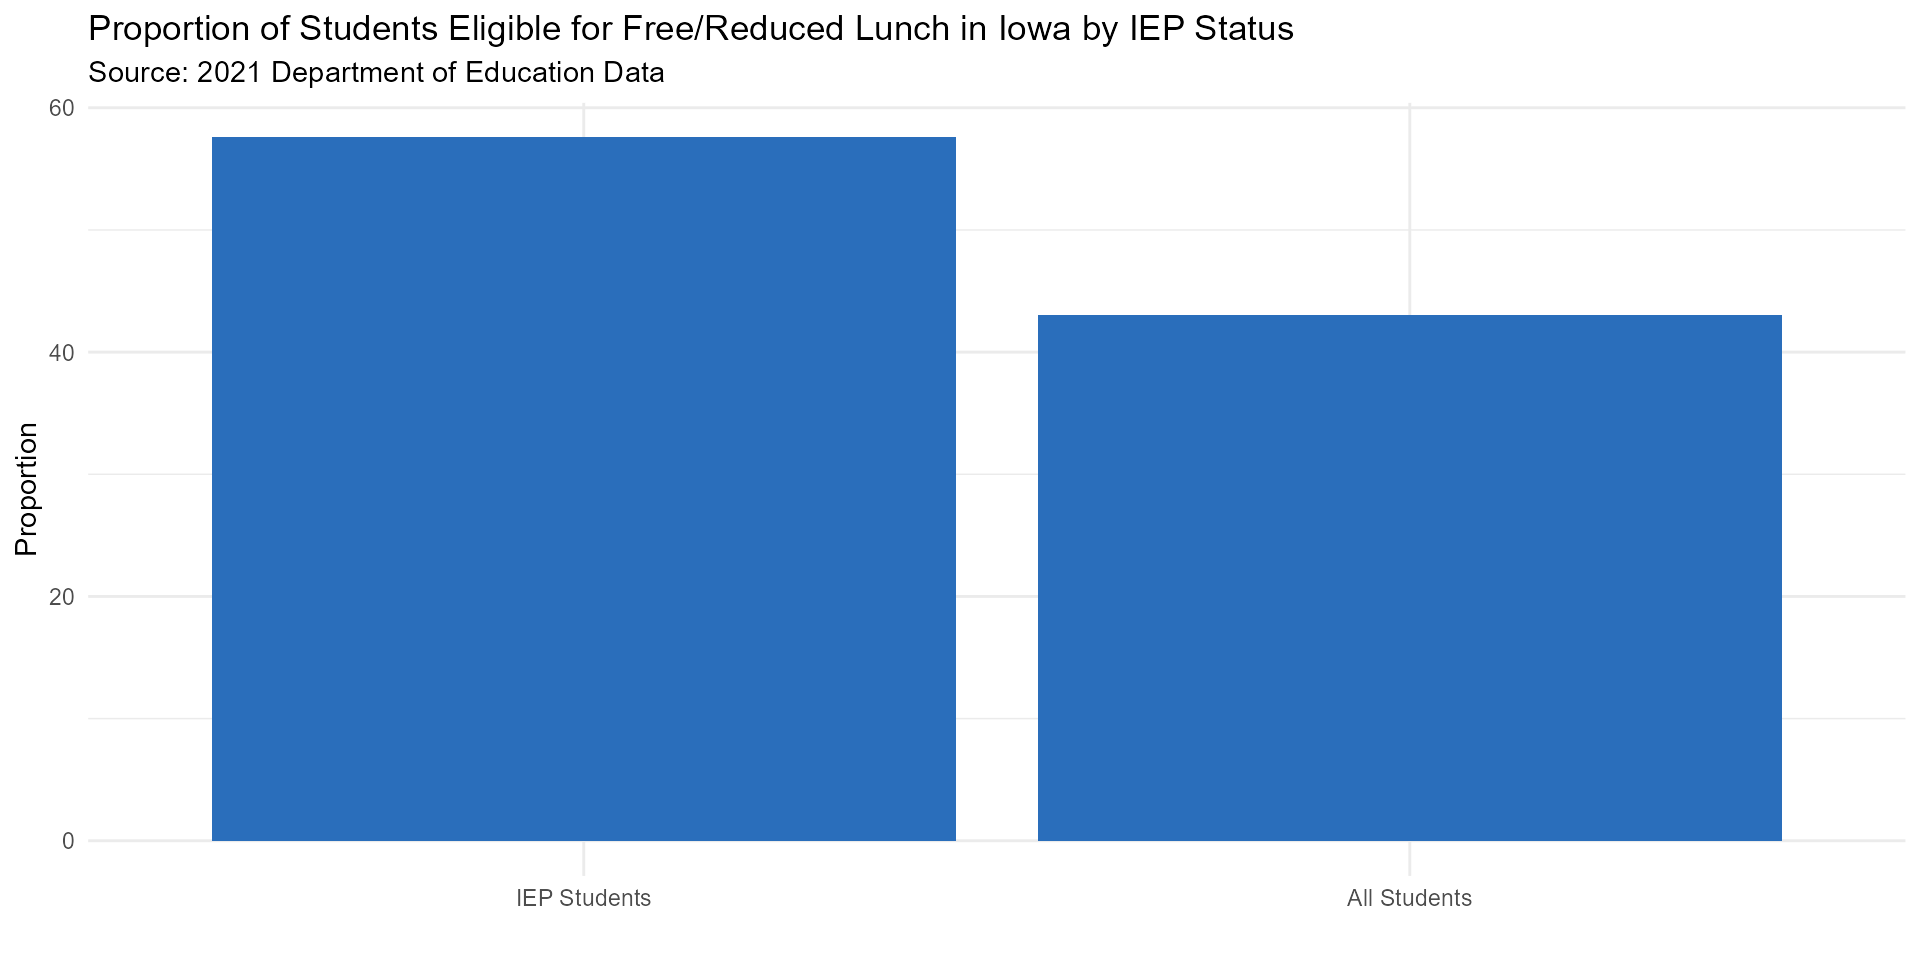
Percent of Students with IEPs by Urban-Rural Classification
rural_iep_bar <- iep_summed %>% mutate(category = fct_relevel(category,
"Over 25,000", "10,000 - 24,999", "2,500 - 9,999",
"500 - 2,499", "Under 500")) %>%
ggplot(aes(x = category, y = proportion, fill = category)) +
geom_bar(stat = "identity", color = "black") +
labs(title = "Proportion of Students with IEPs in Iowa",
subtitle = "Source: Department of Education Data 2018-2019",
x = "",
y = "Propotion",
fill = "Population") +
scale_fill_manual(values = c("#2a6ebb","#8cb1da","#c9c9c9","#e35c74", "#d81e3f")) +
theme_minimal()
rural_iep_bar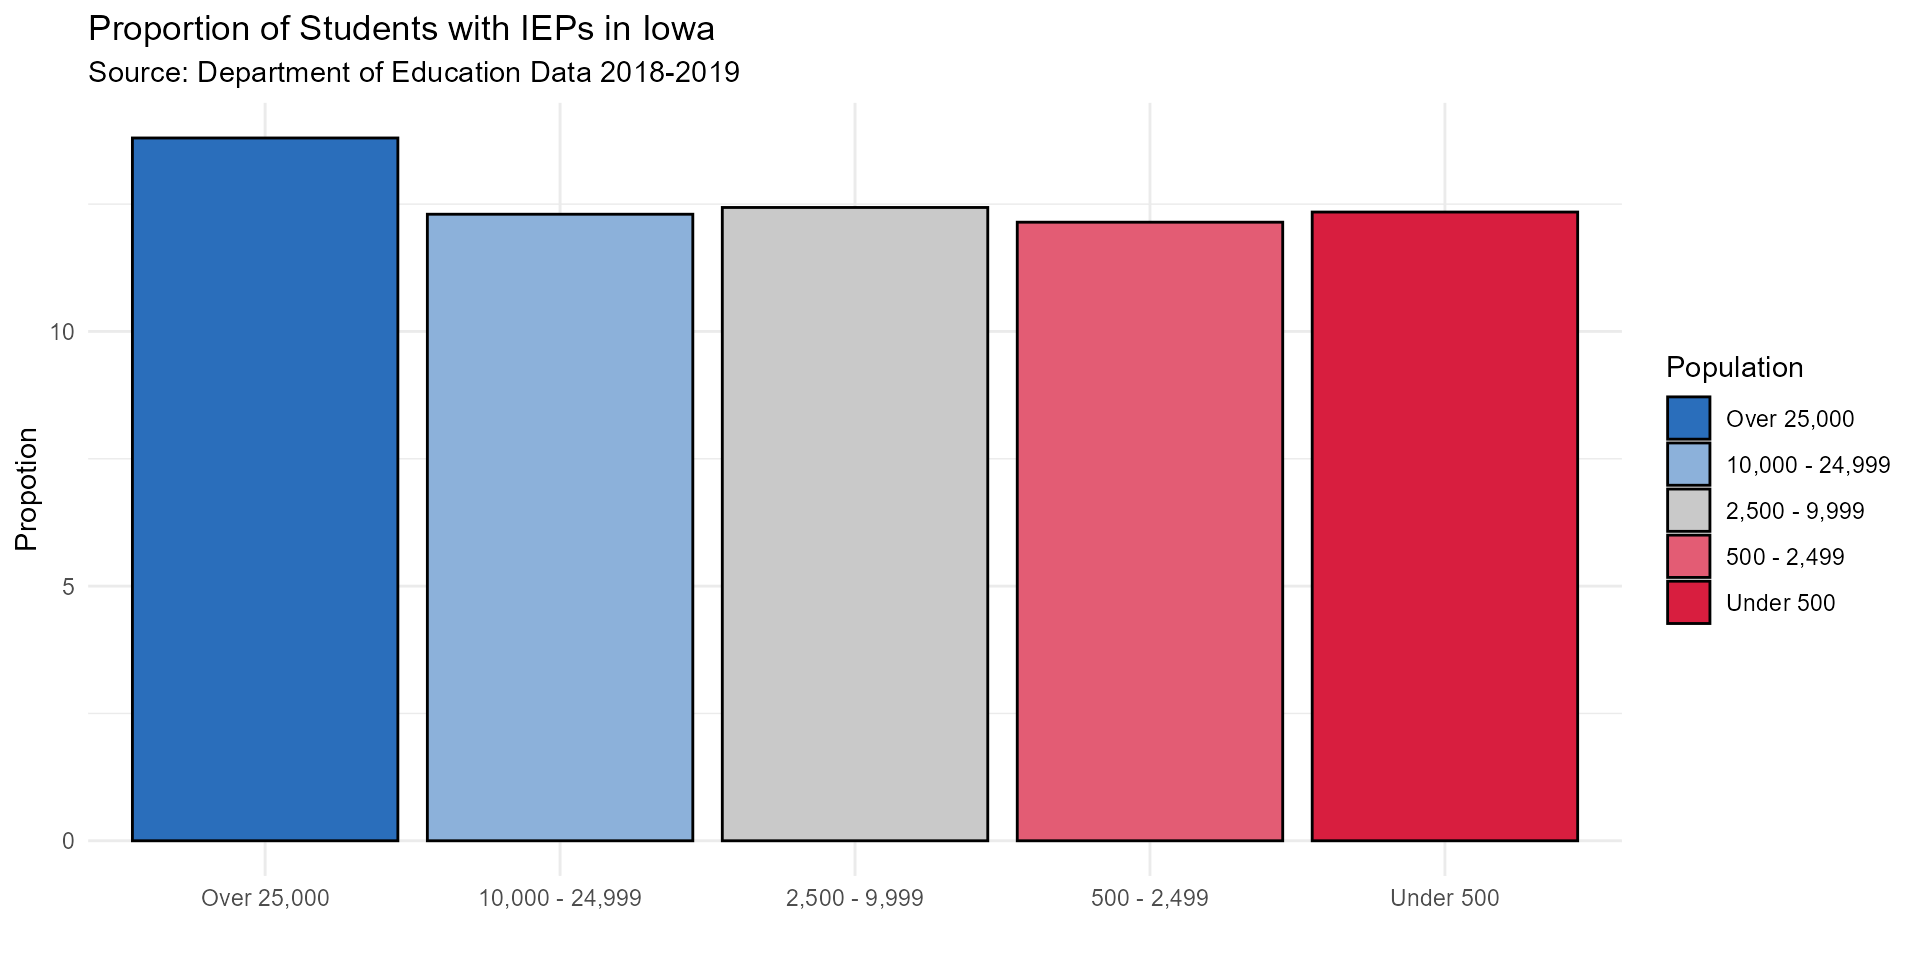
Percent of Students with an IEP by Race
updated_race_bar_graph <- race_props_long %>%
ggplot(aes(x = variable, y = value)) +
geom_bar(stat = "identity", fill = "#D81E3F") +
labs(title = "Proportion of Students with IEPs in Iowa by Race in 2021",
subtitle = "Source: 2021 Department of Education Data",
x = "",
y = "Proportion") +
theme_minimal()
updated_race_bar_graph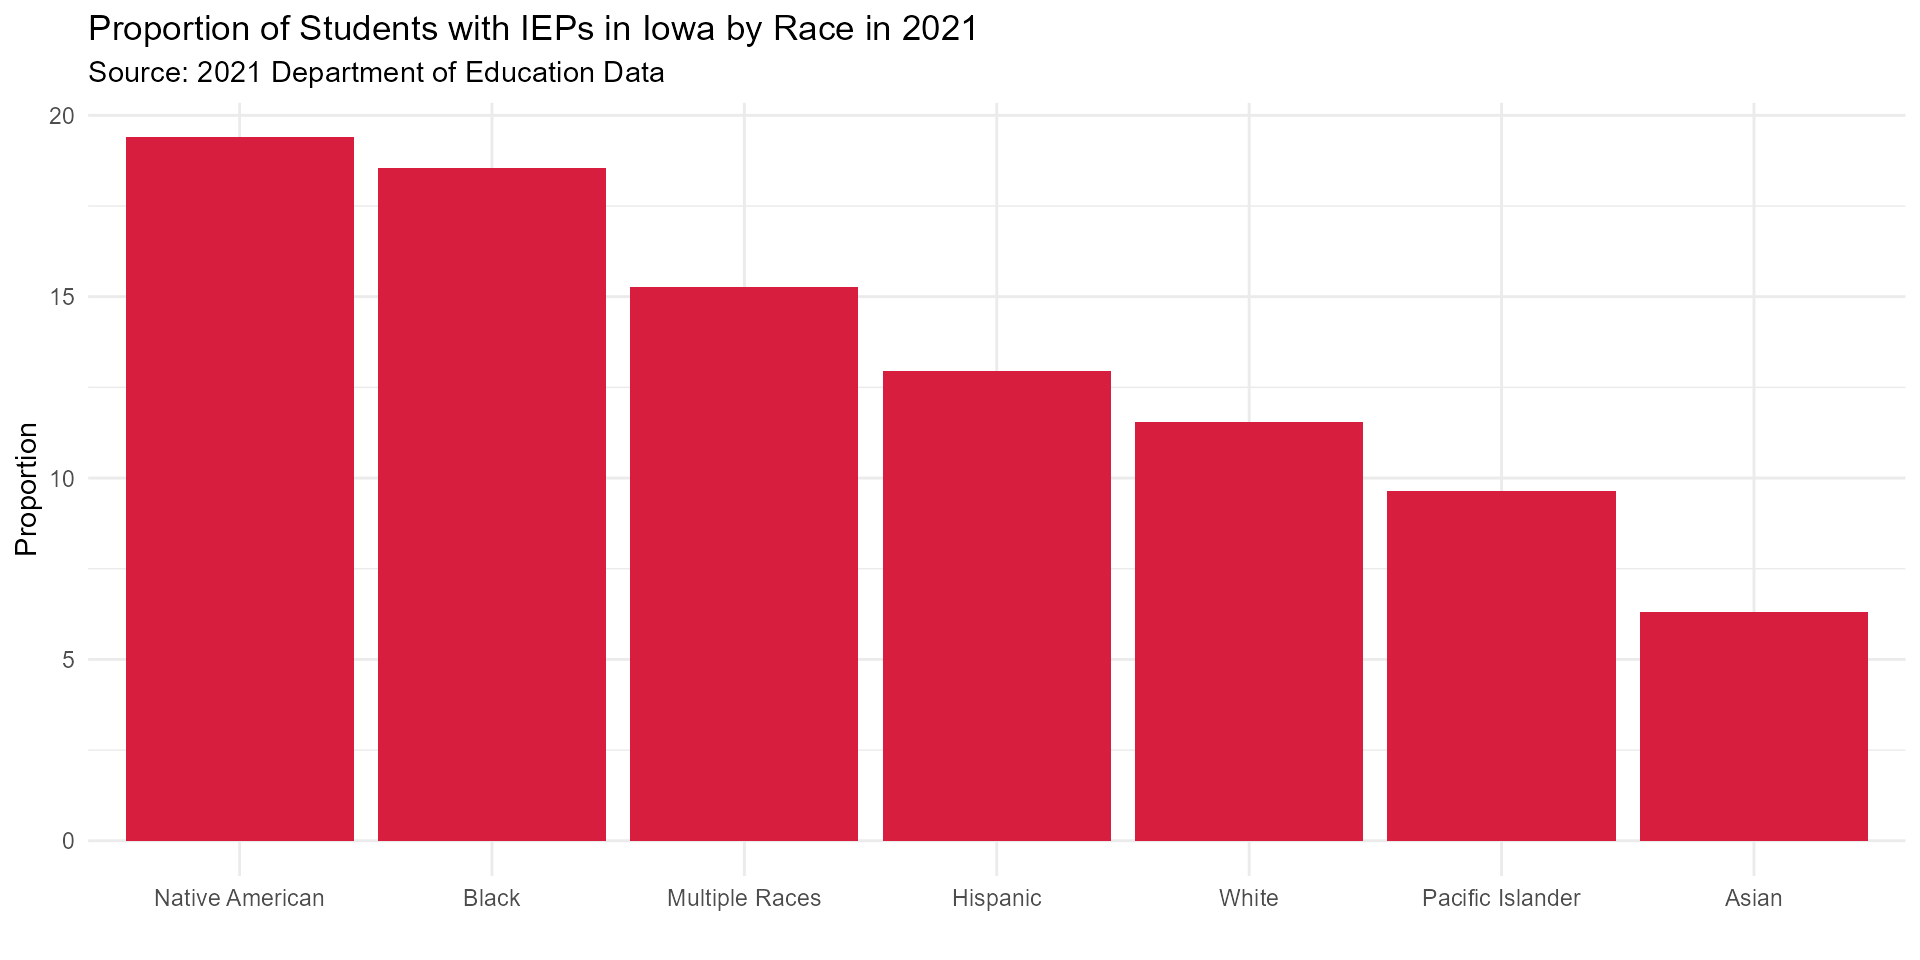
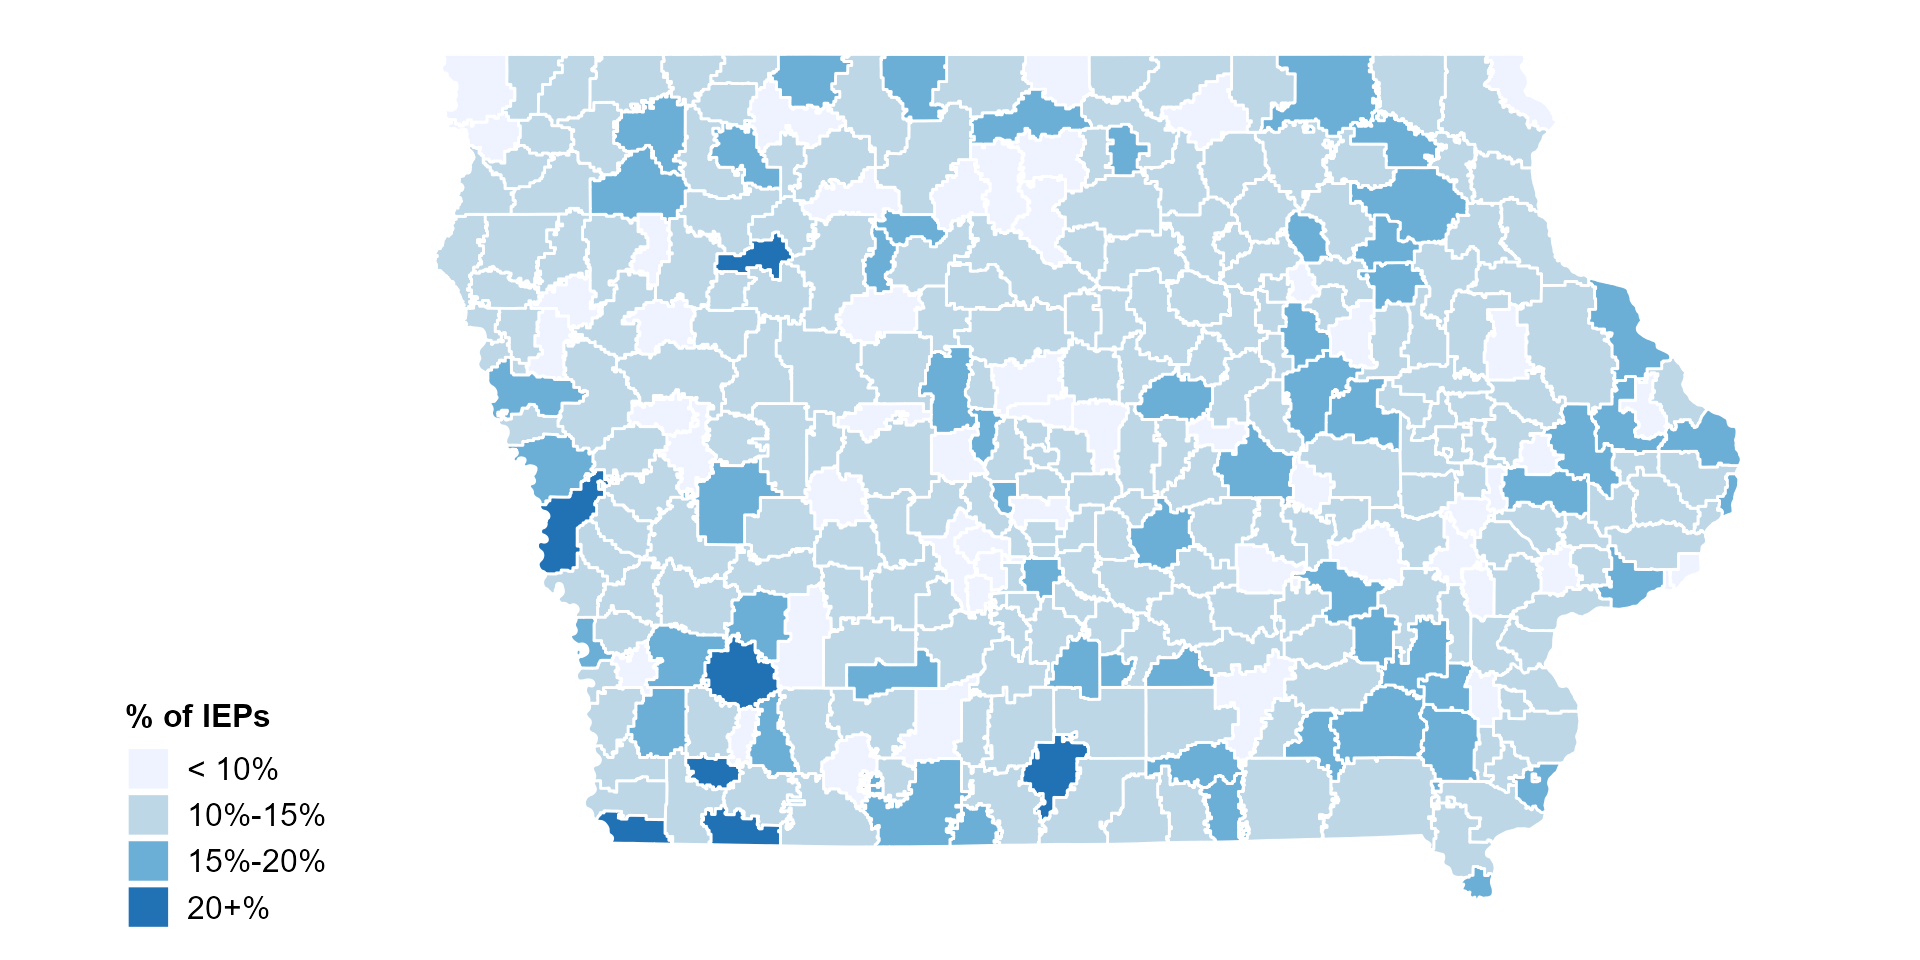
Percent of Students with an IEP by School District
ggplot(iep_map2, aes(fill = prop_bins)) +
geom_sf(color = "white", aes(geometry = geometry)) +
theme_map() +
scale_fill_brewer(palette = "Blues",
name = "% of IEPs",
na.value = "#B3B3B3") +
theme(legend.title = element_text(size = 12, face = "bold"),
legend.text = element_text(size = 12),
legend.position = "left")